FARTCOINUSDT – Probability Analysis for November 19, 2025
FARTCOIN/USDT — Probability Analysis (Nov 19, 2025)
Live market snapshot (facts & sources)
- Current price (approx): $0.25 USDT (real-time feeds show ~$0.25–$0.26). (CoinMarketCap)
- 24-hour range: roughly $0.234–$0.267 USDT depending on exchange (Binance perp shows 24h low 0.2347 / high 0.2671). (Binance)
- 24-hour trading volume: on the order of $100M–$140M USDT across major venues (CoinMarketCap / Binance show large 24h volume). (CoinMarketCap)
- Technical gauge (TradingView): TradingView’s technical indicators for FARTCOIN/USDT currently indicate a “Neutral” status on oscillators & moving averages (multi-timeframe summary). (TradingView)
Notes: prices and volumes update constantly — always refresh TradingView / CoinGecko / exchange pages before trading. (CoinGecko)
Probability scenarios (reproducible thresholds)
(Thresholds chosen to match FARTCOIN’s memecoin volatility): daily = ±3%, weekly = ±10%, monthly = ±25%.
Daily (24-hour)
- Bullish (> +3%): 30%
- Neutral (±3%): 45%
- Bearish (> −3%): 25%
Why (daily): price today sits mid/low in the 24h band, and TradingView signals are neutral. That produces the largest single bucket being rangebound/neutral, with a decent bullish tail because price is closer to the lower band (rebound potential) and sizable 24h volume keeps moves possible. (Binance)
Weekly (7-day)
- Bullish (> +10%): 35%
- Neutral (±10%): 40%
- Bearish (> −10%): 25%
Why (weekly): with seven days, there’s room for momentum from catalysts (listings, social momentum, futures flows). Liquidity is meaningful (high 24h volume), so directional moves are plausible — but the neutral baseline remains most likely unless a clear breakout or major announcement happens. (CoinMarketCap)
Monthly (30-day)
- Bullish (≥ +25%): 40%
- Neutral (±25%): 35%
- Bearish (> −25%): 25%
Why (monthly): meme tokens frequently show large monthly moves — positive social momentum, big exchange flows, or leveraged squeezes can drive outsized up-moves. Given multi-exchange listings and futures/perpetual markets (which amplify directional moves), the bullish tail is the largest on the monthly horizon, while downside risk remains material. (Binance)
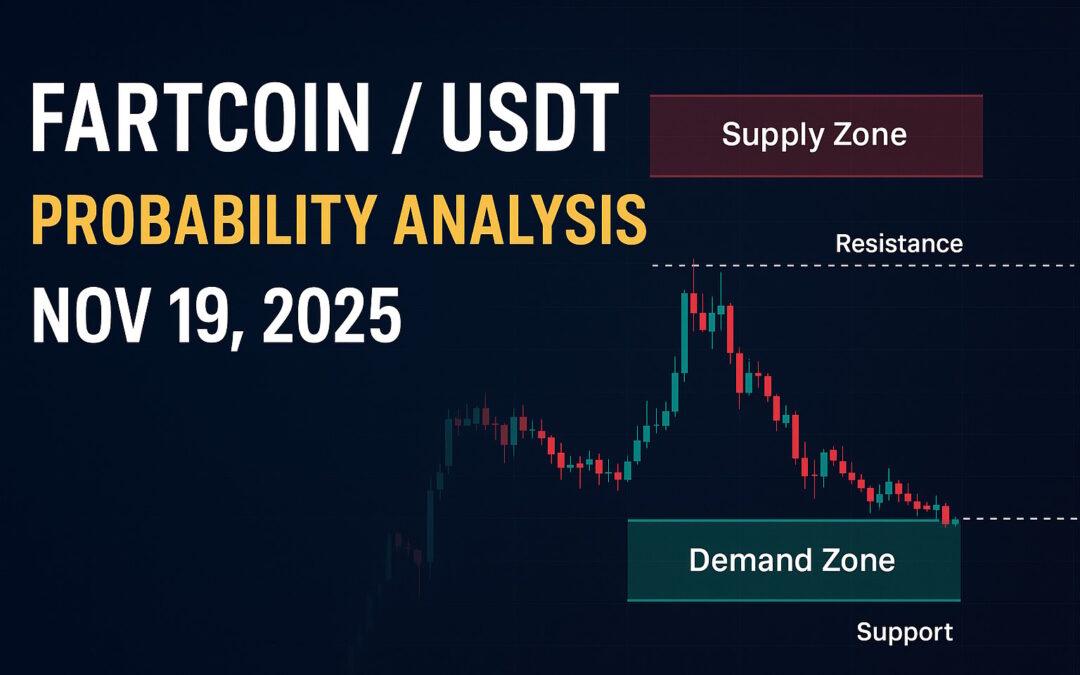
Demand & Supply zones (multi-timeframe) — where buyers & sellers cluster
These zones were identified by scanning recent price action (bases before impulse moves, prior swing highs for supply) across exchanges and timeframes. Treat them as zones (ranges) not exact lines.
Monthly/Major
- Major Demand Zone (monthly): $0.18 – $0.22 USDT — deep accumulation area from earlier pullbacks; major buyer interest is likely if price revisits.
- Major Supply Zone (monthly): $0.32 – $0.36 USDT — higher-timeframe seller concentration and previous multi-week peaks.
Weekly/Intermediate
- Weekly Demand Zone: $0.23 – $0.25 USDT — recent reaction area and the band where price has shown buying interest in the past several sessions. (CoinGecko)
- Weekly Supply Zone: $0.29 – $0.31 USDT — recent local highs where sellers reappeared on rallies. (CoinMarketCap)
Daily/Short-term
- Daily Demand: $0.234 – $0.240 USDT (intra-day support, near 24h lows). (Binance)
- Daily Supply: $0.265 – $0.270 USDT (intraday highs/resistance). (CoinGecko)
Support & Resistance — quick reference levels
- Immediate support: $0.234 – $0.240 USDT (24h low area / daily demand). (Binance)
- Near support (weekly demand): $0.23 – $0.25 USDT. (CoinGecko)
- Immediate resistance: $0.265 – $0.270 USDT (24h high/daily supply). (Binance)
- Key resistance (weekly/monthly supply): $0.29 – $0.36 USDT (watch $0.29–0.31 for weekly, $0.32–0.36 for major supply). (CoinMarketCap)
Trading cues to watch
- Bullish trigger: daily close above $0.27–$0.28 with rising volume → shift probabilities toward bullish for weekly/monthly. (Binance)
- Bearish trigger: daily close below $0.23 with heavy selling → raise bearish probability materially for weekly/monthly. (CoinGecko)
Methodology — transparent & reproducible
- Input live facts: current price, 24h high/low, 24h volume, and exchange listings (CoinMarketCap / Binance / CoinGecko). (CoinMarketCap)
- Baseline technicals: TradingView technical summary (Neutral) to set a starting bias. (TradingView)
- Scenario thresholds: daily ±3%, weekly ±10%, monthly ±25% (modifiable to your risk appetite).
- Identify zones: draw rectangles around the latest consolidations before big price moves (demand) and around prior swing-high clusters (supply). Confirm with volume spikes where possible. (CoinMarketCap)
- Weight & assign probabilities: start with a neutral baseline, then shift percentages up/down based on (a) price position relative to zones, (b) volume strength, (c) technical consensus, and (d) presence of leveraged/futures markets which amplify moves. (Binance)
Risk & trade-management notes
- FARTCOIN is a high-volatility memecoin — keep position sizes small and use tight risk controls.
- Futures/perpetual markets increase liquidation risk; avoid leverage unless you fully understand margin mechanics. (Binance)
- Recompute probabilities when major events occur (listings, viral social traction, large whale flows) — these can flip the model quickly. (CoinMarketCap)
Disclaimer (important)
This content is provided for educational and informational purposes only and does not constitute financial, investment, or trading advice. You should not interpret this analysis as a recommendation to buy, sell, or hold any asset. Always conduct your own research, assess your personal risk tolerance, and consult a licensed financial advisor if necessary before acting.
Engage with One Web One Hub
FARTCOINUSDT Nov19 2025 FI
At One Web One Hub, we publish daily, reproducible market frameworks (like this probability model) to help you think clearly about risk and opportunity. Our posts give you:
- Multi-timeframe scenario probabilities (daily/weekly/monthly)
- Clear supply & demand zones and watch levels you can act on
- Practical trade management guidance to protect capital
If you liked this post, bookmark it, subscribe to daily alerts, share your thoughts in the comments, and use our visual featured images for easy sharing. Grow your trading intelligence — join the One Web One Hub community.


