BITCOINUSDT – Probability Analysis for Apr 10, 2026
Bitcoin Price Forecast – April 10, 2026
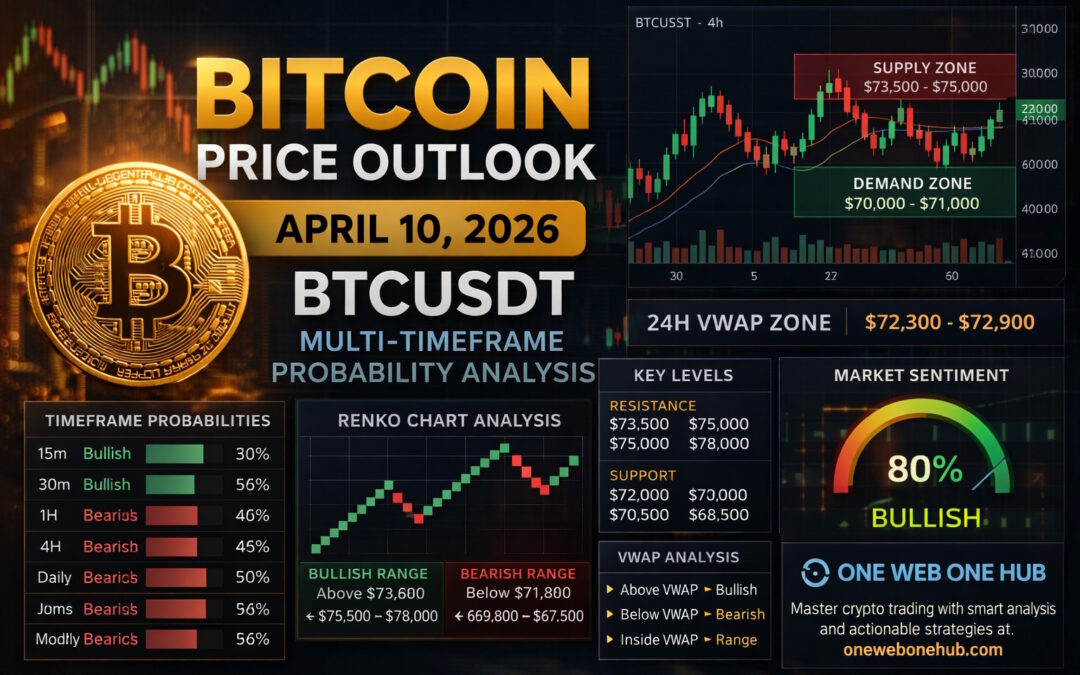
BTCUSDT Multi-Timeframe Probability Analysis, Renko Chart, VWAP Zones, Sentiment & Key Levels
Current Bitcoin Market Overview
Live BTCUSDT Price Context
Bitcoin (BTCUSDT) is currently trading around $72,800 – $73,100, showing strength after reclaiming the $70K psychological level.
Market Structure Insight
- Strong bullish push from ~$69K to ~$73K
- Price approaching major supply zone near $73K – $75K
- Momentum indicators (RSI/Stoch) entering overbought territory
- Volatility expansion after consolidation
This signals a critical decision zone where either breakout continuation or rejection may occur.
BTCUSDT Multi-Timeframe Probability Analysis
15-Minute Timeframe Outlook
Bullish Scenario – Probability 56%
If BTC holds above $72,800
Targets:
- $73,500
- $74,200
- $75,000
Bearish Scenario – Probability 44%
If rejection below $72,500
Targets:
- $71,800
- $71,200
- $70,500
Short-term bias remains bullish but vulnerable to quick pullbacks.
30-Minute Timeframe Outlook
Bullish Scenario – Probability 54%
Break above $73,500
Targets:
- $74,800
- $75,600
- $76,500
Bearish Scenario – Probability 46%
Failure below $72,000
Targets:
- $71,000
- $70,200
- $69,500
1-Hour Timeframe Outlook
Bullish Scenario – Probability 52%
Sustained move above $74,000
Targets:
- $75,500
- $77,000
- $78,800
Bearish Scenario – Probability 48%
Rejection near supply zone
Targets:
- $71,500
- $70,000
- $68,800
4-Hour Timeframe Outlook
Bullish Scenario – Probability 50%
Breakout confirmation above $75,000
Targets:
- $78,000
- $80,500
- $83,000
Bearish Scenario – Probability 50%
Failure to sustain above $72,000
Targets:
- $69,500
- $67,800
- $65,500
4H shows balanced breakout vs rejection conditions.
Daily Timeframe Outlook
Bullish Scenario – Probability 48%
Daily close above $75,000
Targets:
- $80,000
- $85,000
- $92,000
Bearish Scenario – Probability 52%
Rejection from current supply
Targets:
- $68,000
- $64,000
- $60,000
Weekly Timeframe Outlook
Bullish Scenario – Probability 45%
Weekly close above $76,000
Targets:
- $90,000
- $105,000
- $120,000
Bearish Scenario – Probability 55%
Failure below $70,000
Targets:
- $62,000
- $55,000
- $48,000
Monthly Timeframe Outlook
Bullish Macro Scenario – Probability 50%
Continuation above key resistance
Targets:
- $100,000
- $120,000
- $150,000
Bearish Macro Scenario – Probability 50%
Extended correction
Targets:
- $58,000
- $50,000
- $42,000
Renko Chart Analysis
Renko Trend Structure
- Strong bullish brick sequence formed from $69K to $73K
- Momentum slowing near resistance
- No confirmed reversal yet
Bullish Renko Range
Above $73,800
Targets:
- $75,500
- $78,000
Bearish Renko Range
Below $71,800
Targets:
- $69,800
- $67,500
Renko indicates trend continuation possible but exhaustion risk increasing.
Demand and Supply Zones
Key Demand Zones
- $70,000 – $71,000
- $68,000 – $69,000
- $64,000 – $66,000
Key Supply Zones
- $73,500 – $75,000
- $78,000 – $80,000
- $85,000 – $88,000
Support and Resistance Levels
Strong Support
- $72,000
- $70,000
- $68,500
- $65,000
Strong Resistance
- $73,500
- $75,000
- $78,000
- $80,000
VWAP Analysis (24H Estimated Zone)
Estimated VWAP Zones
- Lower Band: $71,800 – $72,200
- Fair Value: $72,300 – $72,900
- Upper Band: $73,000 – $73,800
VWAP Interpretation
- Price above VWAP → bullish continuation
- Price inside VWAP → consolidation
- Price below VWAP → distribution
Current price is hovering at upper VWAP, indicating potential breakout or rejection zone.
Market Sentiment Analysis
Current Sentiment
- Community sentiment: Bullish (~80%)
- Technical sentiment: Overbought caution
Sentiment Price Zones
Bullish Sentiment
$73,500 – $78,000
Neutral Sentiment
$71,000 – $73,500
Bearish Sentiment
$68,000 – $71,000
Market sentiment shows optimism but risk of profit-taking near resistance.
Basis of Probability Modeling
Methodology Used
Multi-Timeframe Alignment
Short-term vs macro trend comparison
Liquidity Zones
Where large orders are likely placed
VWAP Positioning
Institutional fair value zones
Renko Trend Strength
Momentum confirmation
Support & Resistance Confluence
Key reaction levels
Sentiment Indicators
Retail + smart money behavior
This combined framework improves probability accuracy in volatile markets.
Bitcoin Market Outlook Summary
Most Probable Range
$70,000 – $78,000
Key Breakout Levels
- Bullish breakout: Above $75,000
- Bearish breakdown: Below $70,000
Bitcoin is currently at a decision zone near resistance, where the next major move will be defined.
Educational Disclaimer
This content is for educational and informational purposes only and should not be considered financial advice. Cryptocurrency markets are highly volatile and involve significant risk. Always conduct your own research and consult a professional before making trading decisions.
Explore More at One Web One Hub

10 Apr 2026 BITCOINUSDT FI (Referral Link)
Stay Ahead in Crypto Markets
At One Web One Hub, we provide:
- Daily Bitcoin and altcoin forecasts
- Multi-timeframe probability analysis
- VWAP and liquidity strategies
- Smart money trading concepts
- Beginner to advanced trading education
Why Follow One Web One Hub
Because understanding the market beats guessing it.
Visit regularly and transform your trading knowledge into a consistent edge.
Previous Post BITCOINUSDT – Probability Analysis for Apr 03, 2026
Next Post BITCOINUSDT – Probability Analysis for Apr 17, 2026


