ADAUSDT – Probability Analysis for Apr 13, 2026
ADAUSDT Price Analysis – April 13, 2026
Current Market Overview
Live Price Snapshot
Based on the latest available data:
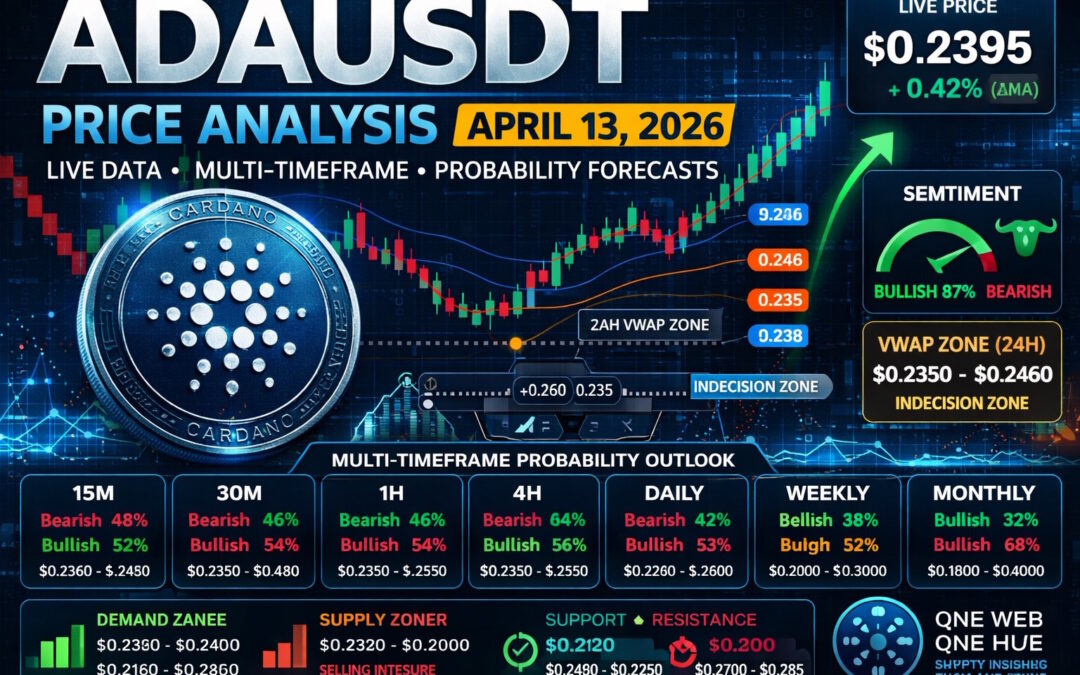
- Current Price: $0.2395
- 24H Change: +0.42% (Slightly Bullish)
- Volume (24H): ~$449M
- Market Sentiment: Bullish (87%) vs Bearish (13%)
The market shows early recovery signals after a prior decline, with price stabilizing near a key demand zone.
Market Structure Analysis
Short-Term Structure
Price action is forming tight consolidation near $0.24, indicating a potential accumulation phase before a directional move.
Mid-Term Structure
The 4H structure shows weak bearish pressure fading, with buyers stepping in near support.
Long-Term Structure
Macro trend remains in accumulation, with ADA trading significantly below historical highs, suggesting long-term upside potential.
Demand and Supply Zones
Key Demand Zones
- $0.2320 – $0.2400 → Immediate buyer interest
- $0.2100 – $0.2250 → Strong institutional accumulation zone
Key Supply Zones
- $0.2480 – $0.2650 → Short-term selling pressure
- $0.2700 – $0.2850 → Major resistance zone
Support and Resistance Levels
Support Levels
- $0.2320
- $0.2250
- $0.2100
Resistance Levels
- $0.2480
- $0.2600
- $0.2700
24H VWAP Zone Analysis
Estimated VWAP Range
- Lower Band: $0.2350
- VWAP Equilibrium: $0.2400
- Upper Band: $0.2460
VWAP Interpretation
- Above VWAP → Bullish intraday control
- Below VWAP → Bearish pressure
- Around VWAP → Equilibrium zone
Current price near VWAP equilibrium suggests market indecision with breakout potential.
Multi-Timeframe Price Probability Analysis
15-Minute Timeframe
- Range: $0.2360 – $0.2450
- Bullish Probability: 52%
- Bearish Probability: 48%
Minor bullish bias with tight consolidation.
30-Minute Timeframe
- Range: $0.2350 – $0.2480
- Bullish Probability: 54%
- Bearish Probability: 46%
Gradual strength building above support.
1-Hour Timeframe
- Range: $0.2320 – $0.2550
- Bullish Probability: 56%
- Bearish Probability: 44%
Accumulation phase with breakout potential.
4-Hour Timeframe
- Range: $0.2250 – $0.2650
- Bullish Probability: 53%
- Bearish Probability: 47%
Bearish trend weakening, reversal possible.
Daily Timeframe
- Range: $0.2200 – $0.2800
- Bullish Probability: 58%
- Bearish Probability: 42%
Bounce likely from current levels.
Weekly Timeframe
- Range: $0.2000 – $0.3000
- Bullish Probability: 62%
- Bearish Probability: 38%
Strong accumulation trend.
Monthly Timeframe
- Range: $0.1800 – $0.4000
- Bullish Probability: 68%
- Bearish Probability: 32%
Macro recovery phase remains intact.
Renko Chart Analysis
Renko Structure
- Current Trend: Sideways transitioning to bullish
- Brick Formation: Mixed with early green dominance
Key Renko Levels
- Support Base: $0.2300
- Breakout Level: $0.2480
- Trend Confirmation: Above $0.2600
Renko Price Range
$0.2300 – $0.2600
Renko suggests consolidation before breakout, with bullish signals slowly emerging.
Sentiment Analysis
Market Sentiment Overview
- Bullish: 87%
- Bearish: 13%
Sentiment Interpretation
- Strong bullish sentiment despite low price
- Indicates possible smart money accumulation
Sentiment Price Ranges
- Bullish Zone: $0.2480 – $0.2700
- Neutral Zone: $0.2350 – $0.2480
- Bearish Zone: Below $0.2320
Basis of Probability Analysis
The probability framework is based on:
Key Factors
- Multi-timeframe trend alignment
- Support and resistance strength
- VWAP positioning and price clustering
- Renko trend confirmation
- Volume and liquidity zones
- RSI and momentum indicators
- Market sentiment data
Methodology
- Confluence of signals increases probability strength
- Weak or mixed signals reduce confidence
- Strong zones heavily influence direction
High Probability Trading Scenarios
Bullish Scenario (60%)
Break above $0.2480 → Target $0.2600 – $0.2700
Consolidation Scenario (30%)
Price ranges between $0.2350 – $0.2480
Bearish Scenario (10%)
Break below $0.2320 → Target $0.2250
Trading Insight Summary
- Market Phase: Accumulation
- Key Breakout Level: $0.2480
- Key Support Level: $0.2320
- Bias: Slightly Bullish
Disclaimer
This content is for educational purposes only and does not constitute financial or investment advice. Cryptocurrency markets are highly volatile and risky. Always conduct your own research before making trading decisions.
Please Follow & Support One Web One Hub – Your Daily Crypto Edge
13 Apr 2026 ADAUSDT FI (Referral Link)
At One Web One Hub, we transform raw market data into actionable insights that help you stay ahead.
What you get:
- Daily crypto analysis
- Multi-timeframe strategies
- Smart money concepts simplified
- Consistent trading education (
If you want to improve your trading and stay updated:
- Bookmark the website
- Visit daily for fresh insights
- Share with fellow traders
Your edge in crypto starts with knowledge — and consistency builds success.
Previous Post ADAUSDT – Probability Analysis for Apr 06, 2026
Next Post ADAUSDT – Probability Analysis for Apr 20, 2026


