
FARTCOINUSDT – Probability Analysis for January 29, 2026
FARTCOIN/USDT Price Probability Analysis – January 29, 2026
Live Price Update
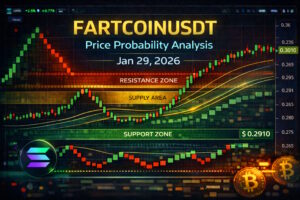
According to composite exchange data, FARTCOIN/USDT is trading around ~$0.2910 USDT, with the 24-hour range near $0.2855 (bid) – $0.2935 USDT across major spot markets. This reflects a continued price structure beneath $0.30, aligning with broader Solana meme coin dynamics. (ChartExchange)
This post uses that real live price as the anchor for multi-timeframe probability analysis across 15-minute to monthly charts, supplemented with structural interpretation.
Probability Analysis Methodology
Rather than predicting exact numbers, this analysis uses probability ranges derived from:
• Multi-Timeframe Confluence — aligning signals across 15m, 30m, 1H, 4H, Daily, Weekly, and Monthly timeframes
• Support & Resistance Clustering — repeat reaction zones visible on live price charts
• Renko Chart Trends — filtering noise to highlight structural pressure
• VWAP Fair-Value Bias Estimation — approximate 24-hour fair value zone based on recent price ranges
• Sentiment & Volume Context — recent trader behavior and market mood interpreted
This creates likelihood zones rather than precise target predictions.
15-Minute & 30-Minute Short-Term Outlook
15-Minute
• Bullish (~30–40%): Short bounces toward ~$0.295–$0.298 if buyers defend near the bottom of the short range.
• Neutral (~40–50%): Sideways range between $0.287–$0.295.
• Bearish (~20–30%): Failure under $0.285 leads toward $0.280–$0.284.
30-Minute
• Bullish (~35–45%): Sustained above ~$0.295 could test $0.298–$0.302.
• Neutral (~40–50%): Range between $0.285–$0.295.
• Bearish (~20–30%): Break below $0.280 exposes deeper short levels.
Short timeframes show typical range compression and quick liquidity pulls.
1-Hour & 4-Hour Mid-Term Outlook
1-Hour
• Bullish (~40%): Reclaiming short-term resistance near $0.300 may lift probability toward $0.305–$0.310.
• Neutral (~40–50%): Continuing sideways $0.275–$0.300.
• Bearish (~20–30%): Loss of $0.275 targets $0.265–$0.274.
4-Hour
• Bullish (~45%): Higher closes above $0.302 can extend toward $0.320–$0.330.
• Neutral (~40–50%): Choppy behavior between $0.250–$0.302.
• Bearish (~15–25%): Breakdown under $0.250 points toward $0.230–$0.245.
Midterm charts reflect wider swings and structural range boundaries.
Daily, Weekly & Monthly Probability Outlook
Daily
• Bullish (~40%): Daily close above $0.305 hints toward $0.335–$0.350.
• Neutral (~40–50%): Broad sideways $0.260–$0.305.
• Bearish (~20–30%): Below $0.260 increases downside toward $0.230–$0.255.
Weekly & Monthly
Longer horizons capture broader market sentiment and macro rotation:
• Weekly Bullish (~40%): Sustained weekly recovery toward $0.350+.
• Weekly Neutral (~40–50%): Extended range $0.230–$0.350.
• Weekly Bearish (~20–30%): Breakdown to $0.200+.
Monthly dynamics widen further due to meme coin volatility and macro positioning.
Renko Chart Interpretation
Renko charts filter time noise and emphasize price thresholds:
-
Compressed Renko bricks around the current range indicate sideways pressure and indecision.
-
Lack of sustained upward Renko bricks above ~$0.300 shows limited bullish conviction.
-
Support bricks near $0.260–$0.275 reflect deeper demand zones where buyers historically appear.
Renko helps visualize structural pressure beyond ordinary candlestick noise.
Demand & Supply Zones
Demand / Support Areas
• $0.260–$0.275 USDT — near-term demand where price often rebounds.
• $0.230–$0.250 USDT — deeper structural support if broader weakness unfolds.
Supply / Resistance Areas
• $0.295–$0.310 USDT — primary short-term supply where rallies struggled.
• $0.330-$0.350 USDT — broader upside resistance visible in past price clusters.
These zones mark areas where buyers and sellers historically congregate.
Support & Resistance Levels
Key structural levels include:
Support: 0.275, 0.260, 0.245 USDT
Resistance: 0.295, 0.310, 0.330 USDT
These represent areas where price has repeatedly tested and reacted.
VWAP Bias (24-Hour Fair Value Estimate)
Direct VWAP indicator access isn’t available here, but we infer fair value based on recent clustering:
Estimated 24H VWAP Zone: $0.285–$0.295 USDT
Interpretation:
• Above this zone → Short-term bullish bias.
• In this zone → Balanced intraday range.
• Below this zone → Bearish intraday tendency.
VWAP approximations help determine where most volume interest may center over a session.
Sentiment Analysis
Technical Sentiment: Short-term oscillators signal mixed momentum with occasional bounce attempts into resistance. Structural indicators reflect consolidation rather than trend acceleration.
Market Sentiment: Broader Solana meme coin sentiment is mixed, with traders slowly rotating between meme assets and other high-beta tokens. Solana meme coins have seen variable performance, with some outperformers even amid overall declines. (CoinMarketCap)
Overall sentiment currently appears neutral-cautious, with bullish outlook increasing only if key resistance levels break convincingly.
Probability Bands Summary
|
Timeframe |
Bullish Target |
Neutral Range |
Bearish Target |
|---|---|---|---|
|
15 min |
$0.295–$0.300 |
$0.285–$0.295 |
$0.275–$0.285 |
|
30 min |
$0.300–$0.305 |
$0.280–$0.300 |
$0.265–$0.280 |
|
1 hr |
$0.305–$0.310 |
$0.275–$0.305 |
$0.260–$0.275 |
|
4 hr |
$0.310–$0.330 |
$0.260–$0.310 |
$0.240–$0.260 |
|
Daily |
$0.330–$0.350 |
$0.260–$0.330 |
$0.230–$0.260 |
|
Weekly |
$0.350–$0.380 |
$0.230–$0.350 |
$0.200–$0.230 |
|
Monthly |
$0.380–$0.450+ |
$0.200–$0.380 |
$0.150–$0.200 |
These bands represent probability-weighted ranges, not precise predictions, reflecting live market structure and sentiment.
Disclaimer
This content is educational and informational only. It does not constitute financial, investment, trading, tax, or professional advice. Cryptocurrency markets are highly volatile; always conduct your own research and consult qualified professionals before making financial decisions.
Please Follow & Bookmark One Web One Hub — Your Crypto Probability Center
2026 Jan 29 FARTCOINUSDT FI
At One Web One Hub, we publish daily probability-based crypto market analysis using real live data, multi-timeframe structure, Renko trend filtering, VWAP bias approximation, demand/supply mapping, and sentiment interpretation.
Bookmark our blog, share useful posts with your community, and return daily for analytical insights that help you understand price behavior and navigate volatile markets with clarity.
One Web One Hub — your hub for crypto clarity in chaotic markets.
Source: Live aggregated price data showing FARTCOIN/USDT trading near $0.2910 with 24-hour range $0.2855–$0.2935. (ChartExchange)
Previous Post FARTCOINUSDT – Probability Analysis for January 28, 2026
Next Post FARTCOINUSDT – Probability Analysis for January 30, 2026


