
FARTCOINUSDT – Probability Analysis for January 28, 2026
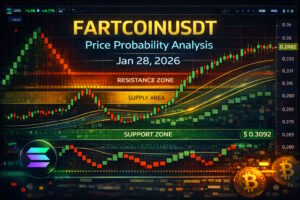
FARTCOIN/USDT Price Probability Analysis — January 28, 2026
Live Price Update
As of today, FARTCOIN/USDT is trading around ~0.3092 USDT, based on aggregated live market data. Daily price history shows recent closes around 0.2961–0.3092 USDT, with notable strength compared to last week’s lower ranges. (CoinMarketCap)
This latest live price range will be the foundation for our probability-based analysis across multiple timeframes.
Probability Analysis Methodology
Instead of predicting exact price points, this analysis uses probability bands derived from:
- Multi-Timeframe Confluence: Observing structural cues from 15m to Monthly charts.
- Support & Resistance Clustering: Zones where price repeatedly reacts.
- Renko Chart Filtering: Removing time noise to focus on meaningful trend moves.
- VWAP Fair-Value Zone Approximation: Estimating where intraday volume might anchor price.
- Sentiment & Volume Context: Reflecting trader psychology and market pressure.
Together, these principles help identify probability-weighted price ranges rather than fixed targets.
15-Minute & 30-Minute Outlook
15-Minute Timeframe
Price near ~0.309 USDT shows short-term volatility compression:
- Bullish (~30–40%): Quick push toward 0.315–0.320 if buyers defend intraday support.
- Neutral (~40–50%): Sideways between 0.304–0.312.
- Bearish (~20–30%): Break below 0.300 leads toward 0.295–0.297.
30-Minute Timeframe
Smoother short-term momentum provides early directional cues:
- Bullish (~35–45%): Sustained rally above 0.315 could target 0.320–0.325.
- Neutral (~40–50%): Range between 0.300–0.315.
- Bearish (~20–30%): Failure below 0.295 opens 0.285–0.295.
These ranges reflect short-term trades reacting to order flow near current price clusters.
1-Hour & 4-Hour Outlook
1-Hour Timeframe
Mid-term structure remains balanced:
- Bullish (~40%): Break above 0.315 with follow-through volume could extend toward 0.325–0.335.
- Neutral (~40–50%): Consolidation near 0.295–0.315.
- Bearish (~20–30%): Weakness under 0.295 suggests deeper pullback.
4-Hour Timeframe
Intermediate behavior sees broader swings:
- Bullish (~45%): Sustained close above 0.320 may point to 0.340+.
- Neutral (~40–50%): Range trade between 0.280–0.320.
- Bearish (~15–25%): Break under 0.280 may lead to 0.260–0.275.
These frames help identify where swing traders may react to structural breakouts or breakdowns.
Daily, Weekly & Monthly Probability Analysis
Daily Timeframe
- Bullish (~40%): Daily close above 0.320 gears toward 0.345–0.360.
- Neutral (~40–50%): Compression between 0.270–0.320.
- Bearish (~20–30%): Failure under 0.270 opens lower bands.
Weekly Timeframe
- Bullish (~40%): Weekly gains above 0.330 make higher ranges likely.
- Neutral (~40–50%): Extended sideways 0.240–0.330.
- Bearish (~20–30%): Loss of key weekly support leads lower.
Monthly Timeframe
- Bullish (~40%): Macro structure favors broader upward if key levels hold.
- Neutral (~40–50%): Wide range trading due to meme coin volatility.
- Bearish (~20–30%): Extended downtrends hold if support breaks.
Higher timeframes widen probability bands to account for macro market variability.
Renko Chart Analysis
Renko charts, which filter time-based noise and focus on price movement thresholds, currently show:
- Compressed Renko bricks near recent price cluster, indicating range congestion and indecision.
- A lack of sustained bullish brick structure above ~0.315 suggests limited upward conviction.
- Support bricks around ~0.285–0.295 align with key demand zones where buyers historically appear.
Renko’s structural clarity reinforces range-bound pressure rather than decisive breakout trends.
Demand and Supply Zones
Identifying key areas where buying or selling concentration historically reacted:
Demand (Support) Areas
- 0.275–0.290 USDT: near-term demand zone with frequent bounces.
- 0.250–0.265 USDT: deeper structural support if the range weakens. (CoinMarketCap)
Supply (Resistance) Areas
- 0.315–0.330 USDT: immediate supply where rallies typically slow.
- 0.350–0.380 USDT: broader supply cluster seen in recent retracement attempts. (CoinMarketCap)
Support and resistance here represent clustered liquidity rather than precise lines.
Support & Resistance Levels
Key Support Levels
0.290
0.275
0.260
Key Resistance Levels
0.315
0.330
0.350
These levels often correspond to where price has repeatedly stalled or reversed.
VWAP (24-Hour Fair Value Bias)
Although direct VWAP indicator values are unavailable here, we estimate the 24-hour VWAP fair-value zone based on recent intraday clustering around current price action:
Estimated 24H VWAP Zone: 0.300–0.308 USDT
Interpretation
- Price above this zone: intraday bullish lean.
- Price inside this zone: neutral intraday balance.
- Price below this zone: intraday bearish bias.
VWAP proxies help indicate where volume may concentrate in intraday trading.
Sentiment Analysis
Technical Sentiment: Many technical indicators on short to mid-term frames show neutral to slightly bullish signals, reflecting recent bounce attempts near support. Oscillators suggest neither extreme oversold nor overbought conditions. (TradingView)
Market Sentiment: Cryptomarket and meme coin participation often depend on broader risk appetite. Community chatter generally remains cautious but engaged around the sub-0.35 range, with traders watching key breakouts. Broader sentiment trackers indicate a mix of accumulation and profit-taking behavior.
Overall sentiment remains neutral-cautious, with bullish bias increasing only upon reclaiming higher structural bands.
Probability Bands Summary
| Timeframe | Bullish Target | Neutral Range | Bearish Target |
|---|---|---|---|
| 15 min | $0.315–$0.320 | $0.304–$0.312 | $0.295–$0.304 |
| 30 min | $0.320–$0.325 | $0.300–$0.320 | $0.285–$0.300 |
| 1 hr | $0.325–$0.335 | $0.290–$0.325 | $0.270–$0.290 |
| 4 hr | $0.335–$0.350 | $0.270–$0.335 | $0.250–$0.270 |
| Daily | $0.345–$0.360 | $0.270–$0.345 | $0.245–$0.270 |
| Weekly | $0.350–$0.380 | $0.250–$0.350 | $0.220–$0.250 |
| Monthly | $0.380–$0.450+ | $0.220–$0.380 | $0.180–$0.220 |
These bands show probability-weighted potential moves based on structure, sentiment, and historical reaction zones — not guaranteed price paths.
Disclaimer
This content is educational and informational only. It does not constitute financial, investment, trading, tax, or professional advice. Cryptocurrency markets are volatile and risky; always perform your own research and consult professionals before making decisions.
Please Follow Subscribe & BookmarkOne Web One Hub — Your Crypto
2026 Jan 28 FARTCOINUSDT FI
Probability Hub
At One Web One Hub, we provide daily probability-based crypto market analysis using real-time data, multi-timeframe structure, Renko trend filtering, VWAP bias context, demand/supply zone mapping, and sentiment interpretation.
Bookmark our blog, share with your network, and return daily for fresh insights designed to help you think clearly about volatile markets.
One Web One Hub — your hub for crypto clarity in chaotic markets.
Next Post FARTCOINUSDT – Probability Analysis for January 27, 2026
Next Update FARTCOINUSDT – Probability Analysis for January 29, 2026


