FARTCOINUSDT – Probability Analysis for January 07, 2026
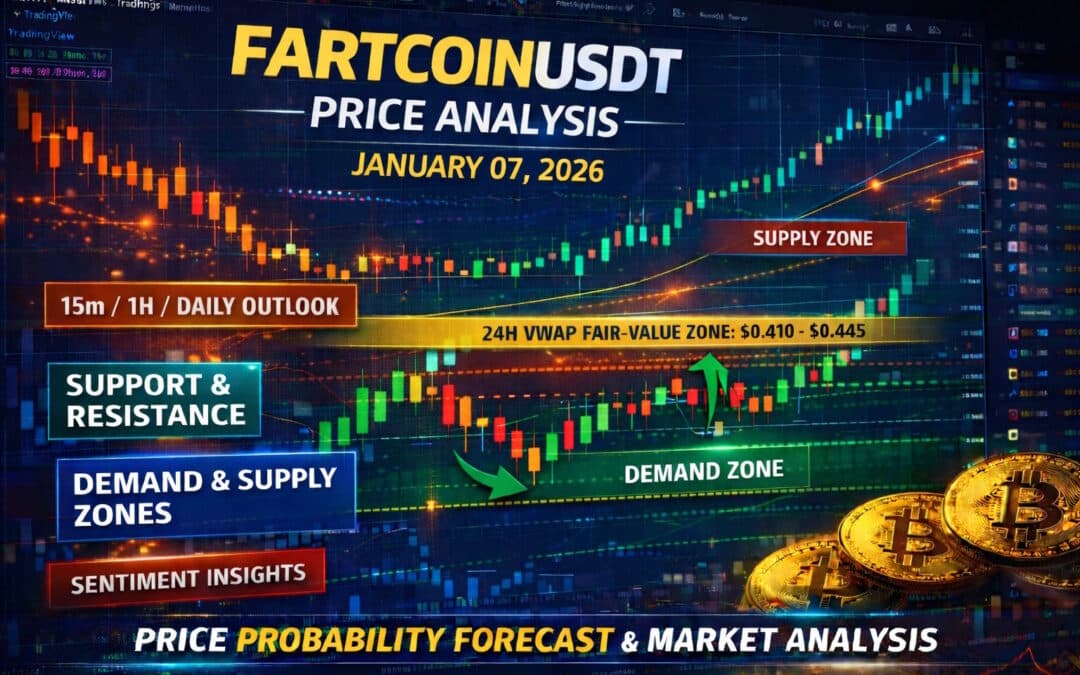
FARTCOINUSDT Price Probability Analysis — January 07, 2026
Welcome to One Web One Hub, your trusted daily source for data-driven crypto trend analysis! Today we investigate FARTCOINUSDT, providing a multi-timeframe price probability forecast based on current live market conditions — including demand & supply zones, support & resistance, sentiment trends, and a practical 24-hour VWAP approximation you can use even if your platform doesn’t have the VWAP indicator.
Live Price Update:
FARTCOIN is trading around approximately $0.4518 USDT in live markets — with a daily price range between ~$0.4140 and $0.4691 USDT. (CoinGecko)
This live data reflects renewed buying interest and provides us with the basis to estimate probability-based price ranges across multiple timeframes.
Multi-Timeframe Price Probability Analysis
📊 15-Minute Chart (Ultra-Short-Term)
- Estimated Range: $0.430 – $0.480
- Price movement on the 15m is choppy and range-bound
- Bullish Break: Above $0.485 → targets $0.500 – $0.515
- Bearish Break: Below $0.430 → test $0.410 – $0.395
- Probability Estimates:
• Range ~50%
• Bullish break ~30%
• Bearish break ~20%
Intraday Insight: The 15m shows short-lived moves without clear trend direction, typical of meme-coin action absent strong catalysts.
📊 30-Minute Chart
- Likely Range: $0.420 – $0.495
- Midrange movement reflects broader balance among buyers and sellers.
- Probabilities: Neutral ~45%, Bullish ~30%, Bearish ~25%
This suggests consolidation with slightly higher odds of upside testing in the short run.
📊 1-Hour Chart
- Key Band: $0.395 – $0.515
- Price action on 1H shows combined swings and reaction clusters.
- Bullish Scenario: Break above $0.515 → potential extension to $0.550+
- Bearish Scenario: Drop below $0.395 → deeper support to $0.360 – $0.340
- Probabilities: Neutral ~45%, Bullish ~30%, Bearish ~25%
The hourly timeframe remains range-dominant but starts reflecting wider distribution compared to intraday.
📊 4-Hour Chart
- Consolidation Zone: $0.350 – $0.600
- Range compression over several sessions highlights resistance at upper bands.
- Probabilities: Range continuation ~50%, Bullish ~30%, Bearish ~20%
The 4H structure aligns with longer range behavior seen across daily price snapshots.
📊 Daily Chart (Swing / Medium-Term)
Demand & Support Zones
- $0.35 – $0.40 USDT — primary demand where buyers historically defend range.
- $0.30 – $0.34 USDT — secondary demand on extended pullbacks.
Supply & Resistance Zones
- $0.50 – $0.55 USDT — immediate overhead supply.
- $0.60 – $0.65 USDT — extended supply where sellers have historically taken profits.
Daily Probability Split:
• Range ~45%
• Bullish break ~30%
• Bearish breakdown ~25%
Daily price structure suggests range continuation as the most likely outcome until buyers or sellers decisively capture momentum.
📊 Weekly & Monthly Charts
- Weekly: Price has stayed within a broad channel near $0.30–$0.60, indicating persistent sideways pressure absent macro catalysts.
- Monthly: Meme coin behavior shows wide oscillations where range probability often dominates over trend.
Longer timeframes continue to show balanced probabilities, with neither a strong, sustained uptrend nor a downtrend dominance.
Support, Resistance & Demand/Supply Zones
Demand / Support Areas
• $0.35 – $0.40 USDT — short-term demand band. (CoinGecko)
• $0.30 – $0.34 USDT — deeper support cluster.
Supply / Resistance Areas
• $0.50 – $0.55 USDT — immediate supply zone. (CoinGecko)
• $0.60 – $0.65 USDT — higher resistance band.
Key Levels to Watch:
• Support Pivot: ~$0.395
• Resistance Pivot: ~$0.515
These zones are where price is most likely to stall, reverse, or break based on historical reactions and liquidity clusters.
Sentiment Analysis
Technical Sentiment
Short-to-medium technical indicators (RSI/MACD) reflect a neutral to slightly bullish bias on recent TradingView price action, as buyers hold above key intermediate supports.
Community & Market Sentiment
Crypto sentiment gauges and social activity signal a mix of optimism and caution — common in meme coins during range oscillation phases.
Macro Influence
FARTCOIN’s sentiment is tied closely to broader crypto risk appetite. Bitcoin/ETH momentum often correlates with meme coin flows, affecting volatility and sentiment dynamics.
VWAP Analysis — 24-Hour Fair Value
Many exchanges (like Bitget) don’t support VWAP directly, so we estimate the 24-hour VWAP fair-value zone based on the recent price range (~$0.4140 – $0.4691). (CoinGecko)
Estimated 24H VWAP Zone: $0.435 – $0.460 USDT
Interpretation Guide
- Above this zone: Intraday bullish bias — price accepted at higher levels.
- At this zone: Fair-value equilibrium — balanced trading.
- Below this zone: Intraday bearish pressure.
This VWAP proxy helps intraday traders assess whether price is trading at a premium or discount to session average without the actual VWAP indicator.
Probability Methodology — Basis of Analysis
Our probability estimates are built from:
- Support & Resistance Clustering: Using recurring levels where price reacts.
- Multi-Timeframe Confluence: Aligning short (15m–1H) and longer (4H–weekly) signals.
- Range & Break Assessment: Assigning probability splits based on historical range behavior.
- VWAP Approximation: Estimating fair-value distribution within the session range.
- Sentiment & Volume Context: Weighing exchange volume and social sentiment signals.
This balanced method delivers probability bands, not single point predictions, and can improve risk-based decision making.
Summary
FARTCOINUSDT is currently in a neutral range-dominant environment near $0.45 USDT, with the highest probabilities favoring range continuation across most timeframes. Key levels to watch include support near $0.395 and resistance near $0.515, while the 24-hour VWAP fair value (~$0.435–$0.460) serves as a reliable intraday pivot.
Price behavior beyond these bands with volume confirmation will help indicate meaningful trend shifts.
Disclaimer
This analysis is educational only and does not constitute financial advice. Cryptocurrency markets are highly volatile and risky. Always perform your own research (DYOR) and consider consulting a licensed financial advisor before making investment decisions.
Please Follow & Subscribe To One Web One Hub
2026 Jan 07 FARTCOINUSDT FI
Thank you for reading this FARTCOINUSDT analysis! At One Web One Hub, we provide:
• Daily multi-timeframe price analysis
• Probability-based forecasts and key zone breakdowns
• Sentiment insights and range structure interpretation
• Practical educational content for traders at all levels
Bookmark the blog, share your thoughts in the comments, and return daily for fresh market insights — One Web One Hub: Your hub for crypto clarity and confidence!
Previous Post FARTCOINUSDT – Probability Analysis for January 06, 2026
Next Post FARTCOINUSDT – Probability Analysis for January 08, 2026


