BITCOINUSDT – Probability Analysis for November 17, 2025
BitcoinUSDT — Probability Analysis & Supply-Demand Zones (Nov 17, 2025)
Live Market Snapshot
-
Approximate price of BTC/USDT: $95,500 USDT (based on recent TradingView data).
-
Technical sentiment from TradingView: Neutral on oscillators and moving averages.
-
Recent 24-hour trading range: ~ $92,900 to ~ $96,100 (based on spot/futures references).
Probability Scenarios
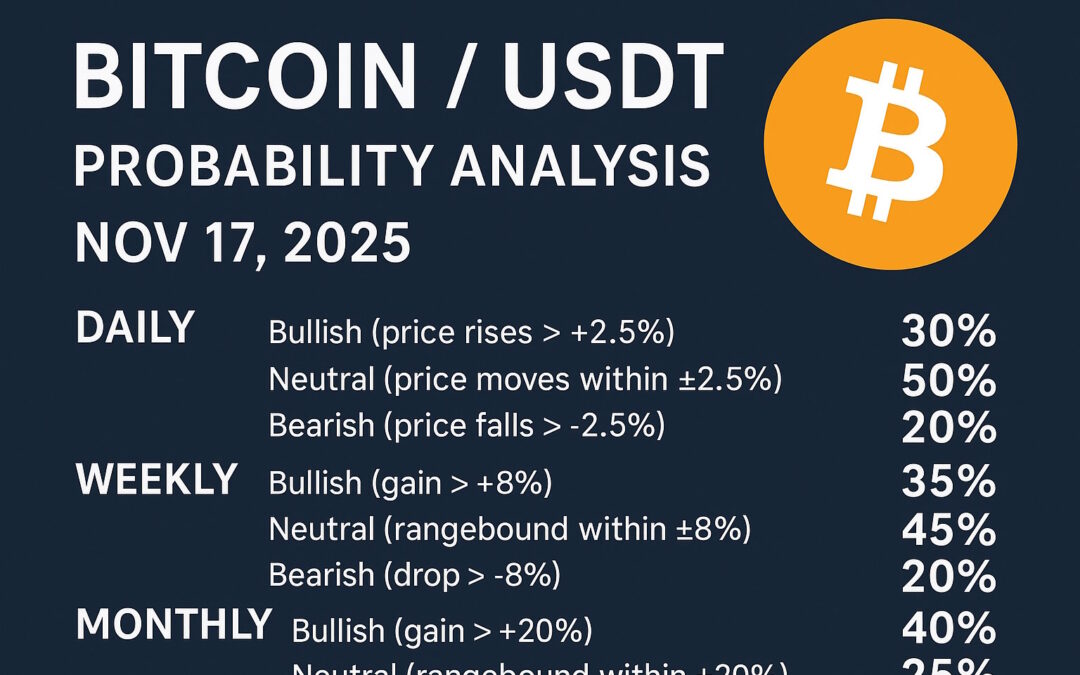
Daily (24-hour) Scenario
-
Bullish (> +2.5%): 30%
-
Neutral (±2.5%): 50%
-
Bearish (> -2.5%): 20%
Rationale (Daily):
-
Current price is in a tight consolidation zone around $95,500, with no strong breakout signal yet.
-
Neutral technical consensus suggests balanced short-term pressure.
-
There is enough volume potential for a move, but without a catalyst, the most likely outcome in the next 24 hours is range-bound.
Weekly (7-day) Scenario
-
Bullish (> +8%): 35%
-
Neutral (±8%): 45%
-
Bearish (> -8%): 20%
Rationale (Weekly):
-
In a week, macro factors (institutional flows, regulatory news) could swing BTC significantly.
-
The neutral technical backdrop supports the highest probability for a range, but there’s a meaningful tail for a bullish breakout due to BTC’s large-cap nature.
-
Bearish risk remains but is not dominant.
Monthly (30-day) Scenario
-
Bullish (≥ +20%): 40%
-
Neutral (±20%): 35%
-
Bearish (> -20%): 25%
Rationale (Monthly):
-
Over a month, Bitcoin can move materially on macro or adoption news. A 20%+ move is not unusual in crypto cycles.
-
The bullish case is strong given BTC’s historical behavior and potential catalysts.
-
Neutral remains plausible, and downside cannot be ignored given macro or technical risks.
Demand & Supply Zones, Support and Resistance
Key Supply & Demand Zones
-
Monthly Demand Zone: ~ $80,000–$85,000 — large potential accumulation zone where past price action may have shown strong buyer interest.
-
Weekly Demand Zone: ~ $90,000–$93,000 — a more immediate demand area, based on recent actions.
-
Weekly Supply Zone: ~ $100,000–$105,000 — potential region where sellers may re-enter aggressively if price reaches.
-
Monthly Supply Zone: ~ $110,000–$120,000 — a higher-timeframe resistance zone that could attract institutional selling.
Support & Resistance Levels
-
Support: ~ $92,500–$93,000 — within the weekly demand area.
-
Resistance: ~ $100,000–$101,000 — psychological resistance, and likely part of the supply zone.
-
Key breakout/breakdown levels:
-
Break above $100K+ on strong volume ➝ increases bullish probability for weekly/monthly.
-
Drop below $92K–$93K with heavy flow ➝ increases bearish risk for weekly/monthly.
-
Why These Zones Make Sense:
-
These zones are identified based on supply-demand imbalance: when the price previously moved sharply (impulse) from these areas, suggesting strong institutional or retail participation. Big candles leaving a base (consolidation) often mark these zones. (Cointelegraph)
-
Using multi-timeframe confirmation strengthens these zones: zones visible on weekly or monthly charts are more significant and likely to cause a reaction. (Traders Union)
-
These zones act as areas where price may be “sticky”: when price returns, it may pause, reverse, or at least exert more friction. (Cointelegraph)
Methodology (How Probabilities Were Derived)
-
Live Data Input: Current BTC/USDT price, recent range, volume context.
-
Technical Sentiment: Using TradingView’s summarised signal (Neutral) to set a baseline.
-
Scenario Thresholds: Daily ±2.5%, Weekly ±8%, Monthly ±20% — chosen to reflect typical BTC volatility in each timeframe.
-
Historical Context & Asset Profile: Bitcoin’s large-cap and macro-sensitivity means more stability than small alts, but still meaningful tail risk.
-
Weighting: Probabilities are assigned by analyzing:
-
Relative price position within key zones
-
Strength of volume/market structure
-
Technical sentiment + macro risk
-
Risk & Trade-Management Notes
-
Even BTC, as a large-cap asset, can be volatile: use position sizing and risk limits.
-
Use stops or risk limits especially around key zone boundaries: e.g., just below demand zones, or just above supply zones.
-
Leverage (if used) increases risk substantially.
-
Re-evaluate your probability model after major catalysts: big news, on-chain movements, or macro events can change the input drastically.
Disclaimer
This content is provided for educational and informational purposes only. It does not constitute financial, investment, or trading advice. You should not interpret this analysis as a recommendation to buy, sell, or hold any asset. Conduct your own research, assess your personal risk tolerance, and consult a licensed financial advisor if needed before making any investment decisions.
Why You Should Stay with One Web One Hub for Crypto Analysis
BTCUSDT Nov 17 2025 FI
At One Web One Hub, our mission is to deliver clear, structured, and actionable educational content — not hype. With our daily probability-based frameworks, you’ll:
-
Understand multiple time-horizon scenarios (daily, weekly, monthly)
-
Know where key supply and demand zones lie and why they matter
-
Learn how to manage risk with defined support/resistance levels
-
Gain a replicable model: you can reuse our method to recalculate probabilities anytime
Whether you’re a beginner or a more seasoned trader, One Web One Hub gives you the tools and insights to think critically — not just follow the crowd. Join our community, bookmark our analyses, and grow your trading IQ with us.
Next Post BITCOINUSDT – Probability Analysis for February 06, 2026
Previous Post BITCOINUSDT – Probability Analysis for November 10, 2025


