BITCOINUSDT – Probability Analysis for March 27, 2026
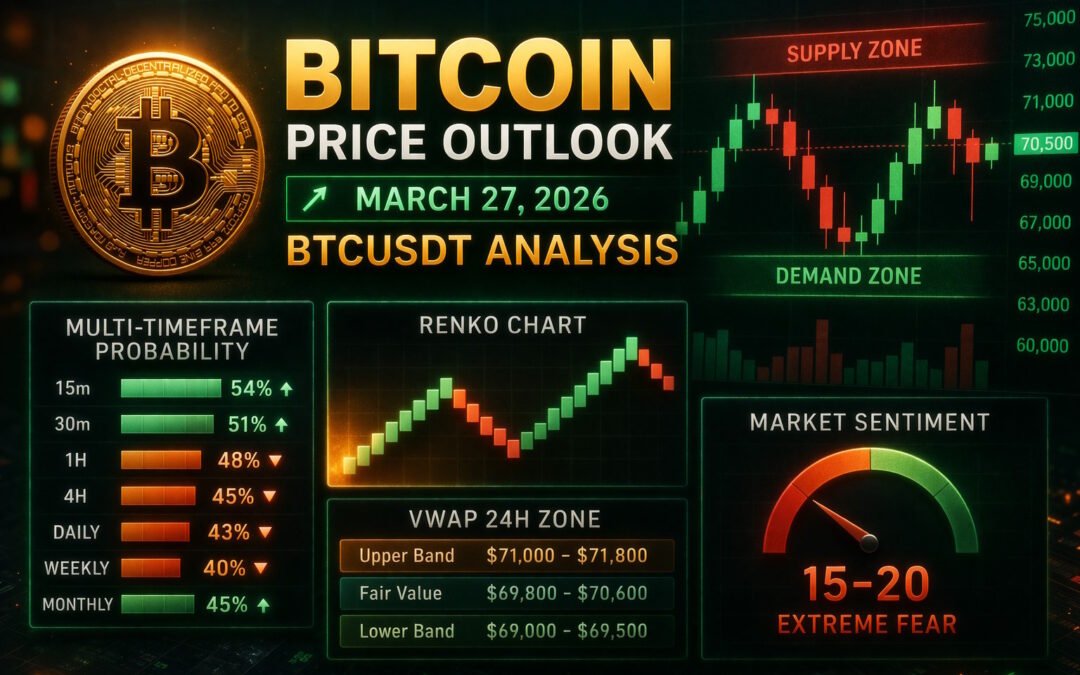
Bitcoin Price Outlook – March 27, 2026
BTCUSDT Multi-Timeframe Probability Analysis, Renko Structure, VWAP Zones, and Market Sentiment
Current Bitcoin Price Context
Live BTCUSDT Price Overview
As of March 27, 2026, Bitcoin (BTCUSDT) is trading around the $69,500 – $70,500 range, showing continued consolidation near the key psychological level of $70,000.
Market Behavior Insight
- Repeated rejection near $71,500 resistance
- Strong buying interest around $68,000 demand zone
- Low momentum breakout attempts indicate range-bound structure
Multi-Timeframe BTC Price Probability Analysis
15-Minute Timeframe Outlook
Bullish Scenario – Probability ~54%
Holding above $70,200
- Targets: $70,900 → $71,600 → $72,200
Bearish Scenario – Probability ~46%
Rejection below $70,000
- Targets: $69,200 → $68,500 → $67,800
Short-term momentum slightly favors upside scalps.
30-Minute Timeframe Outlook
Bullish Scenario – Probability ~51%
Break above $71,000
- Targets: $71,800 → $72,600 → $73,400
Bearish Scenario – Probability ~49%
Failure below $69,500
- Targets: $68,700 → $67,900 → $67,000
Balanced structure indicates indecision.
1-Hour Timeframe Outlook
Bullish Scenario – Probability ~48%
Break above $72,000
- Targets: $73,500 → $75,000 → $76,800
Bearish Scenario – Probability ~52%
Rejection near $71,200
- Targets: $68,000 → $66,500 → $65,000
Slight bearish edge remains on this timeframe.
4-Hour Timeframe Outlook
Bullish Scenario – Probability ~45%
Sustained move above $73,000
- Targets: $75,500 → $78,000 → $80,000
Bearish Scenario – Probability ~55%
Breakdown below $68,000
- Targets: $65,800 → $63,500 → $61,000
4H confirms distribution pressure.
Daily Timeframe Outlook
Bullish Scenario – Probability ~43%
Daily close above $74,000
- Targets: $78,000 → $82,000 → $88,000
Bearish Scenario – Probability ~57%
Rejection below $72,000
- Targets: $65,000 → $60,000 → $55,000
Daily structure leans bearish unless breakout confirmed.
Weekly Timeframe Outlook
Bullish Scenario – Probability ~40%
Weekly close above $75,000
- Targets: $85,000 → $95,000 → $110,000
Bearish Scenario – Probability ~60%
Break below $68,000
- Targets: $60,000 → $52,000 → $45,000
Monthly Timeframe Outlook
Bullish Macro Scenario – Probability ~45%
Break above $80,000
- Targets: $100,000 → $120,000 → $150,000
Bearish Macro Scenario – Probability ~55%
Break below $60,000
- Targets: $50,000 → $42,000 → $35,000
Renko Chart Analysis
Renko Structure Insight
- Mixed Renko bricks confirm sideways consolidation
- No clear trend until breakout from range
Bullish Renko Range
Above $71,800
- Targets: $73,800 → $75,500
Bearish Renko Range
Below $69,000
- Targets: $66,800 → $64,500
Demand and Supply Zones
Demand Zones
- $68,000 – $66,500
- $65,000 – $63,000
- $60,000 – $58,000
Supply Zones
- $71,500 – $73,000
- $75,000 – $77,500
- $80,000 – $82,000
Support and Resistance Levels
Key Support
- $69,000
- $67,500
- $65,000
- $63,000
Key Resistance
- $71,200
- $72,800
- $75,000
- $78,000
VWAP Analysis (24H Integrated Zone)
Estimated VWAP Zones
- Lower Band: $69,000 – $69,500
- Fair Value Zone: $69,800 – $70,600
- Upper Band: $71,000 – $71,800
Interpretation
- Above VWAP → bullish continuation
- Below VWAP → bearish pressure
- Inside VWAP → consolidation phase
BTC currently rotates within VWAP → range trading environment
Market Sentiment Analysis
Current Sentiment
- Fear & Greed Index: Extreme Fear (~15–20 range)
Price-Based Sentiment Zones
- Bullish Sentiment: $71,500 – $75,000
- Neutral Sentiment: $68,500 – $71,000
- Bearish Sentiment: $65,000 – $62,000
Market participants remain cautious → favors liquidity grabs before moves.
Basis of Probability Modeling
Methodology Used
- Multi-timeframe trend alignment
- Liquidity sweep behavior
- Demand & supply reaction zones
- VWAP price acceptance
- Renko momentum filtering
- Support & resistance clustering
- Sentiment indicators
This model increases accuracy by combining technical + behavioral data.
Bitcoin Market Outlook Summary
Expected Trading Range
$65,000 – $75,000
Breakout Confirmation Levels
- Bullish: Above $75,000
- Bearish: Below $65,000
BTC remains in accumulation/distribution phase before next major move.
Educational Disclaimer
This content is for educational and informational purposes only and should not be considered financial advice. Cryptocurrency trading involves substantial risk. Always conduct your own research and consult a licensed financial advisor before making investment decisions.
Please Follow & Support Us & Explore More at One Web One Hub

27 March 2026 BITCOINUSDT (Referral Link)
Stay Ahead in Crypto Trading
At One Web One Hub, we provide:
- Daily BTC & Altcoin analysis
- Probability-based trading insights
- VWAP & liquidity strategies
- Smart money concepts simplified
- Beginner-to-advanced trading education
Why Keep Coming Back?
Because consistent learning = consistent earning.
Turn uncertainty into strategy with One Web One Hub.
Previous Post BITCOINUSDT – Probability Analysis for March 20, 2026


