ATOMUSDT – Probability Analysis for Jun 04, 2026
ATOM/USDT Price Analysis – June 04, 2026
Current Market Overview of Cosmos (ATOM)
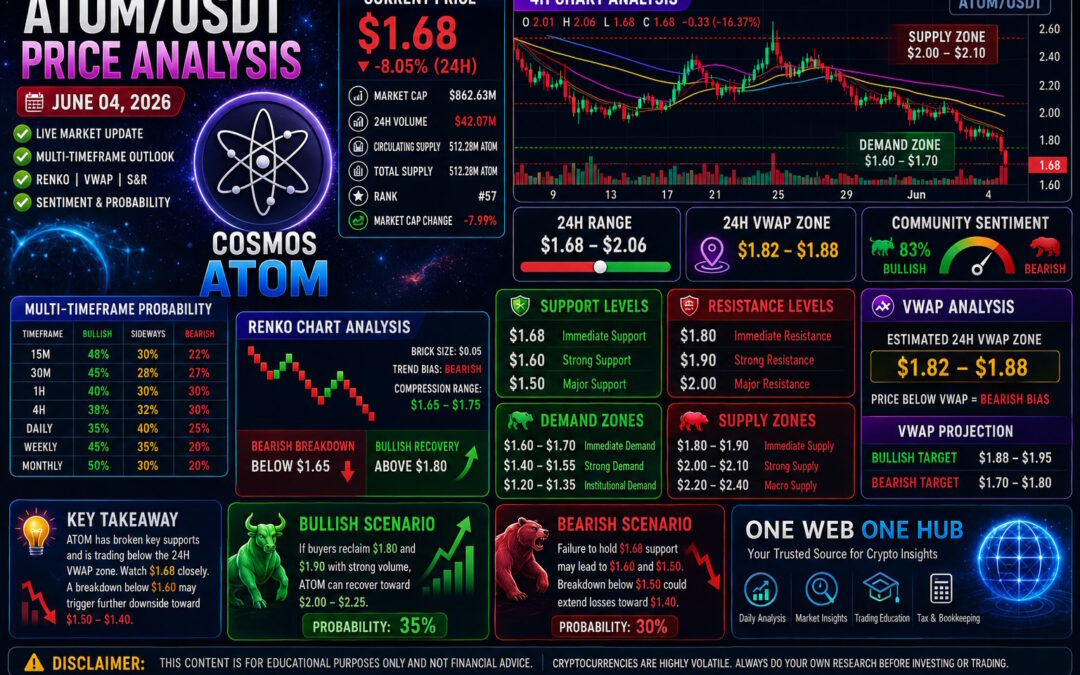
ATOM/USDT has experienced a sharp selloff and is currently trading near the $1.68 region, representing one of the most significant short-term corrections seen in recent weeks. Based on the chart provided, ATOM has broken below several key moving averages and has fallen beneath the recent consolidation zone around $1.90–$2.00.
While community sentiment remains surprisingly optimistic, price action currently favors caution as sellers maintain control across most lower timeframes.
ATOM/USDT Live Market Snapshot
Current Price Metrics
- Current Price: ~$1.68
- 24H Change: -8.05%
- Market Capitalization: ~$862.6M
- Circulating Supply: 512.28M ATOM
- Market Structure: Strong Short-Term Bearish
Intraday Trading Range
- Intraday High: $2.06
- Intraday Low: $1.68
- Daily Range: $1.68 – $2.06
Market Condition
The breakdown below multiple support levels indicates a liquidity flush event. The market is currently searching for a new equilibrium zone.
Multi-Timeframe Price Probability Analysis
15-Minute Timeframe Analysis
Market Structure
Extremely oversold conditions following aggressive liquidation.
Probability Outlook
- Relief bounce toward $1.74 → 48%
- Sideways stabilization → 30%
- Further decline below $1.65 → 22%
Expected Price Range
- $1.65 – $1.74
Observation
Short-term traders may attempt dip-buying near current levels.
30-Minute Timeframe Analysis
Market Structure
Bearish continuation with oversold momentum.
Probability Outlook
- Recovery toward $1.79 → 45%
- Consolidation → 28%
- Further downside → 27%
Expected Price Range
- $1.65 – $1.79
1-Hour Timeframe Analysis
Market Structure
Strong bearish momentum remains intact.
Probability Outlook
- Recovery toward $1.85 → 40%
- Consolidation below resistance → 30%
- Continued decline → 30%
Expected Price Range
- $1.65 – $1.85
Observation
The hourly chart needs to reclaim $1.80 to improve sentiment.
4-Hour Timeframe Analysis
Market Structure
Major breakdown from previous bullish consolidation.
Probability Outlook
- Relief rally toward $1.90 → 38%
- Sideways base formation → 32%
- Continuation toward $1.55 → 30%
Expected Price Range
- $1.55 – $1.90
Daily Timeframe Analysis
Market Structure
Daily trend shifts back into bearish territory.
Probability Outlook
- Recovery phase → 35%
- Extended accumulation → 40%
- Continued decline → 25%
Expected Price Range
- $1.50 – $2.10
Weekly Timeframe Analysis
Market Structure
Long-term accumulation thesis remains intact despite the correction.
Probability Outlook
- Base-building continuation → 45%
- Recovery trend development → 35%
- Major bearish continuation → 20%
Expected Price Range
- $1.40 – $2.50
Monthly Timeframe Analysis
Market Structure
ATOM remains deeply discounted relative to historical valuations.
Probability Outlook
- Long-term accumulation → 50%
- Bullish reversal phase → 30%
- Capitulation scenario → 20%
Expected Price Range
- $1.00 – $4.00
Renko Chart Analysis
Renko Structure Overview
- Estimated Brick Size: $0.05
- Trend Bias: Bearish
- Current Compression Zone: $1.65 – $1.75
Renko Interpretation
Multiple bearish bricks have formed consecutively following the breakdown below $1.90 support.
Renko Confirmation Levels
Bullish Confirmation
- Above $1.80
Bearish Confirmation
- Below $1.65
Renko Price Targets
Bullish Recovery Target
- $1.85 – $1.95
Bearish Target
- $1.50 – $1.60
Demand and Supply Zone Analysis
Major Demand Zones
Immediate Demand Zone
- $1.60 – $1.70
Strong Demand Zone
- $1.40 – $1.55
Institutional Demand Zone
- $1.20 – $1.35
Major Supply Zones
Immediate Supply Zone
- $1.80 – $1.90
Strong Supply Zone
- $2.00 – $2.10
Macro Supply Zone
- $2.20 – $2.40
Support and Resistance Levels
Key Support Levels
- $1.68
- $1.60
- $1.50
Key Resistance Levels
- $1.80
- $1.90
- $2.00
VWAP Analysis
Estimated 24H VWAP Zone
Without direct VWAP indicator access, the VWAP estimate is derived from volume concentration, average trading activity, and intraday structure.
Estimated VWAP Range
- $1.82 – $1.88
VWAP Interpretation
Current price is trading significantly below the estimated VWAP zone.
This indicates:
- Sellers currently dominate
- Recovery attempts likely face resistance near VWAP
- Trend remains bearish until VWAP is reclaimed
VWAP Projection
Bullish VWAP Recovery
- $1.88 – $1.95
Bearish Rejection Zone
- $1.70 – $1.80
Sentiment Analysis
Community Sentiment
Current market sentiment remains highly optimistic despite the correction.
- Bullish Sentiment: 83%
- Bearish Sentiment: 17%
Sentiment Zones
Bullish Sentiment Zone
- Above $1.90
Neutral Zone
- $1.70 – $1.90
Bearish Zone
- Below $1.70
Behavioral Analysis
Retail traders appear to be viewing the decline as a buying opportunity. However, price action suggests waiting for confirmation before assuming a trend reversal.
Basis of Probability Analysis
Methodology
The probabilities used throughout this analysis are based on:
- Multi-timeframe trend alignment
- Historical support and resistance reactions
- Volume concentration analysis
- Estimated VWAP positioning
- Renko trend continuation patterns
- RSI and Stochastic momentum behavior
- Market structure breaks
- Community sentiment data
- Liquidity and order-flow concepts
These probabilities are educational estimates rather than predictive guarantees.
Final Outlook for ATOM/USDT
ATOM is currently experiencing a significant correction phase.
Bullish Scenario
If buyers reclaim:
- $1.80
- $1.90
Potential upside targets become:
- $2.00
- $2.10
- $2.25
Bearish Scenario
Failure to hold:
- $1.68
- $1.60
Could expose:
- $1.50
- $1.40
- $1.25
The next several trading sessions will likely determine whether this move becomes a temporary correction or the beginning of a larger bearish trend.
Educational Disclaimer
This content is provided solely for educational and informational purposes and should not be interpreted as financial advice, investment advice, or trading recommendations. Cryptocurrency markets are highly volatile and involve substantial risk. Always conduct your own research and consult qualified financial professionals before making financial decisions.
Discover More on One Web One Hub
04 Jun 2026 ATOMUSDT FI (Referral Link)
Stay Ahead of the Markets with One Web One Hub
One Web One Hub provides daily educational content covering:
- Cryptocurrency Analysis
- Renko Chart Studies
- VWAP Trading Concepts
- Multi-Timeframe Market Forecasts
- Bookkeeping & Accounting Education
- Tax Planning Resources
- Financial Intelligence Content
Why Readers Return Every Day
Our goal is not simply to report market movements but to help readers understand the reasoning behind them. Every article focuses on education, market structure, risk awareness, and practical analysis techniques that traders can learn from regardless of market direction.
Bookmark One Web One Hub today and join a growing community of traders, investors, accountants, and finance enthusiasts seeking deeper market knowledge and smarter decision-making.
Previous Post ATOMUSDT – Probability Analysis for May 28, 2026


