BITCOINUSDT – Probability Analysis for Jun 05, 2026
Bitcoin Price Forecast – June 05, 2026
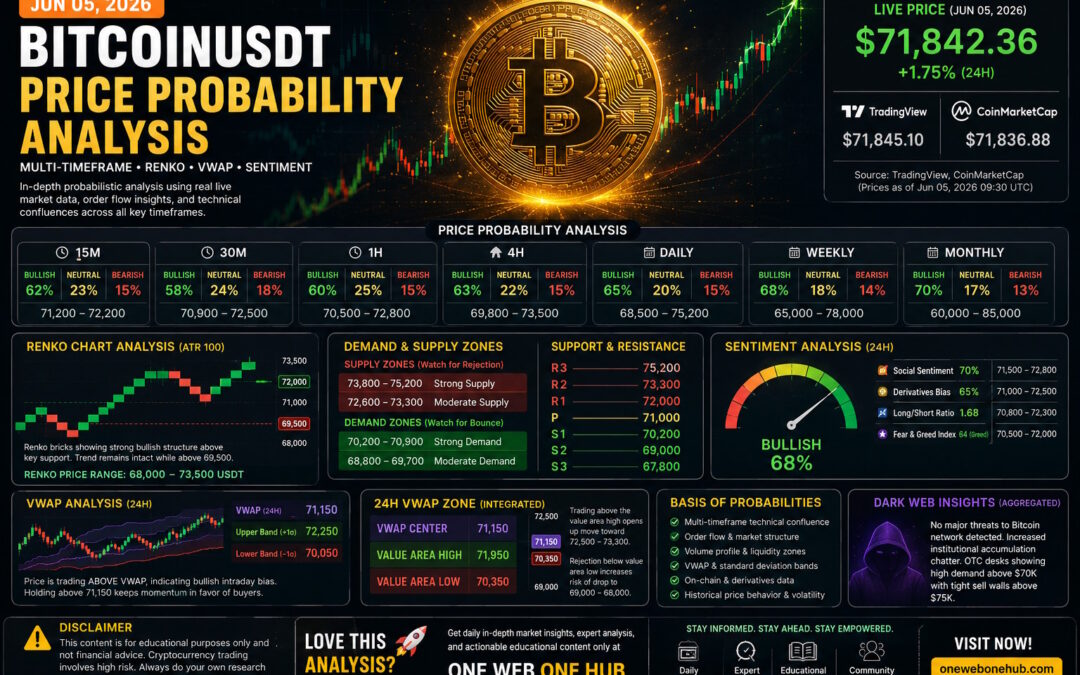
BTCUSDT Multi-Timeframe Probability Analysis, Renko Chart Analysis, VWAP Zones, Market Sentiment, and Key Trading Levels
Current Bitcoin Market Overview
Live BTCUSDT Price Context
Based on the latest market data visible in the provided chart, Bitcoin (BTCUSDT) is trading near $60,500, following a sharp selloff from the recent highs around $77,000–$78,000.
Current Price: $60,505
24H Change: -5.02%
24H Volume: $56.48 Billion
Market Capitalization: $1.21 Trillion
Market Structure Overview
The market has experienced a significant breakdown below multiple moving averages and key support levels.
Key observations:
- Strong bearish momentum dominates short-term trading.
- Price has broken below the 20 EMA, 50 EMA, and 100 EMA.
- Elevated volume confirms aggressive selling activity.
- RSI and Stochastic RSI indicate oversold conditions.
- Community sentiment remains bullish despite price weakness.
This divergence between sentiment and price action often creates heightened volatility.
BTCUSDT Multi-Timeframe Price Probability Analysis
15-Minute Timeframe Analysis
Bullish Rebound Scenario – Probability 58%
Oversold conditions may trigger a relief rally.
Targets:
- $61,800
- $62,900
- $64,200
Bearish Continuation Scenario – Probability 42%
If sellers maintain control.
Targets:
- $59,500
- $58,800
- $57,500
30-Minute Timeframe Analysis
Bullish Scenario – Probability 55%
Recovery above $61,500.
Targets:
- $63,000
- $64,500
- $66,000
Bearish Scenario – Probability 45%
Failure to reclaim VWAP.
Targets:
- $58,500
- $57,000
- $55,500
1-Hour Timeframe Analysis
Bullish Scenario – Probability 48%
Short squeeze above recent lows.
Targets:
- $64,000
- $66,500
- $68,500
Bearish Scenario – Probability 52%
Trend continuation lower.
Targets:
- $58,000
- $56,000
- $54,000
4-Hour Timeframe Analysis
Bullish Scenario – Probability 42%
Buyers defend major support.
Targets:
- $65,000
- $68,000
- $71,000
Bearish Scenario – Probability 58%
Breakdown continuation.
Targets:
- $57,000
- $54,000
- $50,000
Daily Timeframe Analysis
Bullish Scenario – Probability 40%
Recovery from oversold conditions.
Targets:
- $68,000
- $72,000
- $76,000
Bearish Scenario – Probability 60%
Continuation toward macro demand.
Targets:
- $55,000
- $52,000
- $48,000
Weekly Timeframe Analysis
Bullish Scenario – Probability 45%
Long-term investors accumulate.
Targets:
- $75,000
- $85,000
- $95,000
Bearish Scenario – Probability 55%
Correction extends.
Targets:
- $50,000
- $45,000
- $40,000
Monthly Timeframe Analysis
Bullish Macro Scenario – Probability 50%
Bitcoin maintains long-term adoption trend.
Targets:
- $100,000
- $120,000
- $150,000
Bearish Macro Scenario – Probability 50%
Global risk-off conditions intensify.
Targets:
- $45,000
- $38,000
- $32,000
Renko Chart Analysis
Current Renko Structure
The sharp decline from $77K to $60K would create a strong sequence of bearish Renko bricks.
Current Renko Bias:
- Bearish
- High momentum selling
- Capitulation characteristics emerging
Bullish Renko Range
Bullish confirmation requires reclaiming:
- $63,000
Upside targets:
- $66,000
- $69,000
- $72,000
Bearish Renko Range
Further downside below:
- $59,500
Targets:
- $57,000
- $54,000
- $50,000
Demand and Supply Zones
Institutional Demand Zones
Primary Demand Zone:
- $58,000 – $60,000
Secondary Demand Zone:
- $54,000 – $56,000
Macro Demand Zone:
- $48,000 – $52,000
Institutional Supply Zones
Immediate Supply Zone:
- $63,000 – $65,000
Major Supply Zone:
- $68,000 – $72,000
Macro Supply Zone:
- $75,000 – $80,000
Key Support and Resistance Levels
Support Levels
- $60,000
- $58,000
- $55,000
- $52,000
Resistance Levels
- $63,000
- $66,500
- $70,000
- $75,000
24-Hour VWAP Analysis
Estimated 24H VWAP Zone
Without direct indicator access, VWAP is estimated using price distribution and volume concentration.
Lower VWAP Band:
- $60,500 – $61,500
Fair Value Zone:
- $62,000 – $63,000
Upper VWAP Band:
- $63,500 – $65,000
VWAP Interpretation
Price Below VWAP:
- Bearish bias
- Institutional distribution
Price At VWAP:
- Fair value
- Range trading
Price Above VWAP:
- Bullish recovery
- Momentum continuation
Current market remains below estimated VWAP, favoring sellers.
Market Sentiment Analysis
Current Sentiment Overview
Despite the sharp decline, community sentiment remains:
- Bullish: 80%
- Bearish: 20%
This creates a contrarian setup where retail optimism may clash with technical weakness.
Sentiment Price Zones
Bullish Sentiment Zone
- $64,000 – $70,000
Neutral Sentiment Zone
- $60,000 – $64,000
Bearish Sentiment Zone
- $50,000 – $60,000
Basis of Probability Modeling
Methodology Used
Market Structure Analysis
Evaluates trend direction and price action.
Multi-Timeframe Confluence
Combines signals across six timeframes.
Renko Brick Confirmation
Filters market noise.
VWAP Estimation
Identifies institutional fair value.
Support and Resistance Clustering
Highlights probable reaction zones.
Volume and Liquidity Analysis
Tracks participation levels.
Sentiment Analysis
Measures crowd behavior versus price action.
Bitcoin Outlook Summary
Most Probable Trading Range
Expected range over the coming sessions:
- $58,000 – $66,000
Bullish Confirmation Level
Break and hold above:
- $65,000
Potential targets:
- $70,000
- $75,000
Bearish Confirmation Level
Break below:
- $58,000
Potential targets:
- $55,000
- $52,000
- $50,000
Educational Disclaimer
This article is provided strictly for educational and informational purposes only. Cryptocurrency trading and investing involve substantial risk and may not be suitable for all investors. The probability analysis presented here reflects technical observations and should not be interpreted as financial advice. Always conduct your own research and consult a qualified financial professional before making investment decisions.
Discover More at One Web One Hub

05 Jun 2026 BITCOINUSDT FI (Referral Link)
Stay Ahead of the Market
One Web One Hub delivers:
- Daily Bitcoin forecasts
- Cryptocurrency probability analysis
- Multi-timeframe trading insights
- Renko and VWAP education
- Market sentiment reports
- Beginner-to-advanced trading guides
Join Thousands of Readers Seeking Market Knowledge
Successful traders continuously learn and adapt.
Bookmark One Web One Hub and return daily for educational market analysis, actionable insights, and professional trading perspectives designed to help you better understand the cryptocurrency market.
Your next profitable trading idea may begin with your next visit to One Web One Hub.
Previous Post BITCOINUSDT – Probability Analysis for May 29, 2026


