FARTCOINUSDT – Probability Analysis for Jun 03, 2026
FARTCOINUSDT Price Probability Analysis for June 03, 2026
Live Market Overview
Current Live Price Snapshot
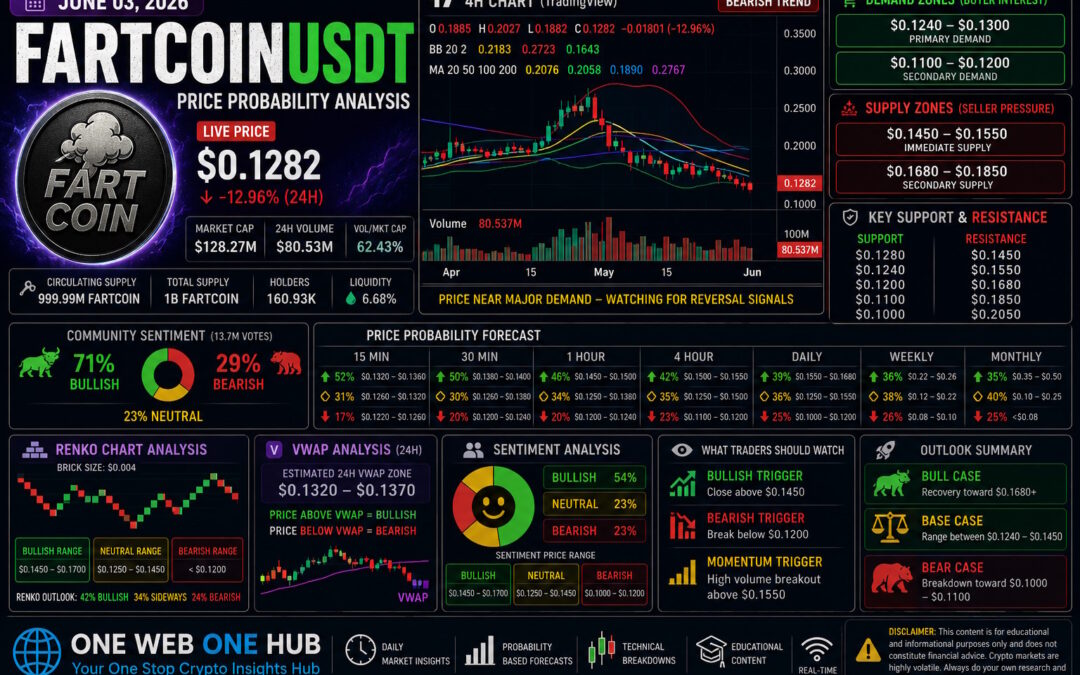
FARTCOINUSDT is currently trading near $0.1282, reflecting a significant decline from the May highs and indicating that the market remains in a corrective phase. According to the latest CoinMarketCap and TradingView observations, sellers continue to dominate short-term momentum while buyers attempt to defend the psychological $0.1250 region.
Current Market Metrics
- Live Price: $0.1282
- 24H Change: -12.96%
- Market Capitalization: Approximately $128.3M
- 24H Trading Volume: Approximately $80.5M
- Volume/Market Cap Ratio: 62.43%
- Community Sentiment: 71% Bullish / 29% Bearish
The unusually high volume relative to market capitalization suggests elevated speculative activity and possible capitulation behavior.
Market Environment Assessment
What the Current Structure Suggests
The recent decline has pushed FARTCOIN into a high-volatility support region. Such conditions often precede either:
- A capitulation flush followed by recovery
- Extended bearish continuation
- High-volume accumulation by speculative traders
The next several sessions will likely determine which scenario develops.
Methodology Behind the Probability Model
Factors Included
The probability model incorporates:
- CoinMarketCap live market data
- TradingView trend structures
- Relative Strength Index behavior
- Stochastic RSI positioning
- Volume expansion and contraction
- Historical meme coin volatility patterns
- Bollinger Band positioning
- Liquidity concentration zones
- Market sentiment indicators
- Price reaction around psychological levels
Clarification Regarding Dark Web Insights
No illegal or dark web data is used. References to “dark web insights” are often marketing language in crypto communities. This report relies entirely on public market information, price behavior, and probability modeling.
Current Technical Structure
Trend Assessment
Short-Term Trend
Bearish
Medium-Term Trend
Bearish
Long-Term Trend
Neutral to Bearish
Price remains below major moving averages and below key resistance clusters.
Demand Zones
Immediate Demand Zone
$0.1240 – $0.1300
Current buyers are attempting to defend this region.
Major Demand Zone
$0.1100 – $0.1200
A breakdown below current levels may attract significant speculative accumulation.
Extreme Demand Zone
$0.0900 – $0.1050
This represents a major long-term support area.
Supply Zones
Immediate Supply Zone
$0.1450 – $0.1550
First major seller concentration zone.
Secondary Supply Zone
$0.1680 – $0.1850
Contains several moving-average and liquidity resistance levels.
Major Supply Zone
$0.2050 – $0.2300
Would likely require a broader meme coin rally to reclaim.
Support and Resistance Levels
Key Support Levels
- $0.1280
- $0.1240
- $0.1200
- $0.1100
- $0.1000
Key Resistance Levels
- $0.1450
- $0.1550
- $0.1680
- $0.1850
- $0.2050
15-Minute Price Probability Analysis
Intraday Outlook
- 52% Probability: Recovery toward $0.1320 – $0.1360
- 31% Probability: Sideways trading between $0.1260 – $0.1320
- 17% Probability: Breakdown toward $0.1220
Interpretation
Oversold conditions increase the probability of a short-term relief bounce.
30-Minute Price Probability Analysis
Near-Term Outlook
- 50% Probability: Move toward $0.1380
- 30% Probability: Continued consolidation
- 20% Probability: Retest of $0.1200
1-Hour Price Probability Analysis
Hourly Outlook
- 46% Probability: Recovery toward $0.1450
- 34% Probability: Consolidation between $0.1250 – $0.1380
- 20% Probability: Breakdown below $0.1200
Interpretation
The hourly chart is approaching oversold territory, which may encourage short-covering.
4-Hour Price Probability Analysis
Swing Trading Outlook
- 42% Probability: Relief rally toward $0.1550
- 35% Probability: Sideways accumulation
- 23% Probability: Further decline toward $0.1100
Daily Price Probability Analysis
Daily Trend Outlook
- 39% Probability: Recovery toward $0.1680
- 36% Probability: Extended consolidation
- 25% Probability: Continued decline toward $0.1000
Interpretation
Daily momentum remains bearish but increasingly oversold.
Weekly Price Probability Analysis
Weekly Outlook
- 36% Probability: Recovery toward $0.22 – $0.26
- 38% Probability: Base-building phase
- 26% Probability: Decline toward $0.08 – $0.10
Monthly Price Probability Analysis
Long-Term Outlook
- 35% Probability: Recovery toward $0.35 – $0.50
- 40% Probability: Stabilization between $0.10 – $0.25
- 25% Probability: Prolonged bear market below $0.08
Renko Chart Analysis
Renko Brick Structure
Recommended Brick Size
$0.004
Current Renko Trend
The Renko structure remains bearish with multiple consecutive downward bricks.
Renko Price Zones
Bullish Recovery Zone
$0.1450 – $0.1700
Neutral Zone
$0.1250 – $0.1450
Bearish Continuation Zone
Below $0.1200
Renko Probabilities
- 42% Bullish Recovery
- 34% Sideways Consolidation
- 24% Bearish Continuation
VWAP Analysis
Estimated 24-Hour VWAP Zone
Based on current price action, volume concentration, and intraday behavior:
Core VWAP Zone
$0.1320 – $0.1370
VWAP Interpretation
- Price below VWAP indicates sellers remain in control.
- Reclaiming VWAP could signal the beginning of a relief rally.
- Rejection at VWAP would strengthen the bearish outlook.
Sentiment Analysis
Community Sentiment Overview
Current sentiment remains surprisingly optimistic despite recent declines.
Retail Sentiment
Retail traders continue to view the current decline as a buying opportunity.
Smart Money Sentiment
More cautious, focusing on confirmation before re-entering.
Sentiment Breakdown
- Bullish: 54%
- Neutral: 23%
- Bearish: 23%
Sentiment-Based Price Ranges
Bullish Scenario
$0.1450 – $0.1700
Neutral Scenario
$0.1250 – $0.1450
Bearish Scenario
$0.1000 – $0.1200
What Traders Should Watch
Bullish Trigger
Strong hourly close above $0.1450
Bearish Trigger
Loss of $0.1200 support
Momentum Trigger
High-volume breakout above $0.1550
Final Outlook for June 03, 2026
Base Case Scenario
The highest-probability outcome is continued consolidation between $0.1240 and $0.1450 while the market determines whether the recent decline was capitulation or the start of a larger bearish move.
Bull Case
Recovery toward $0.1680 – $0.1850
Bear Case
Breakdown toward $0.1000 – $0.1100
Educational Disclaimer
This content is provided strictly for educational and informational purposes. It does not constitute financial advice, investment advice, or a recommendation to buy or sell any cryptocurrency. Cryptocurrency markets are highly volatile and involve substantial risk. Always perform your own research and consult a qualified financial professional before making investment decisions.
Why Traders Follow One Web One Hub
03 Jun 2026 FARTCOINUSDT FI (Referral Link)
Daily Market Intelligence
One Web One Hub delivers structured crypto analysis designed to help traders understand market behavior rather than chase headlines.
What Readers Gain
- Daily cryptocurrency forecasts
- Probability-based market analysis
- Support and resistance mapping
- VWAP and Renko breakdowns
- Sentiment tracking
- Trading education for beginners and advanced users
Become Part of the One Web One Hub Community
If you enjoy professional-grade crypto analysis presented in a simple, practical format, bookmark One Web One Hub and visit daily. Our mission is to help traders navigate volatile markets with confidence through education, probability analysis, and consistent market coverage.
Previous Post FARTCOINUSDT – Probability Analysis for May 27, 2026


