SOLUSDT – Probability Analysis For May 19, 2026
SOLUSDT Price Probability Analysis for May 19, 2026
Live Market Overview
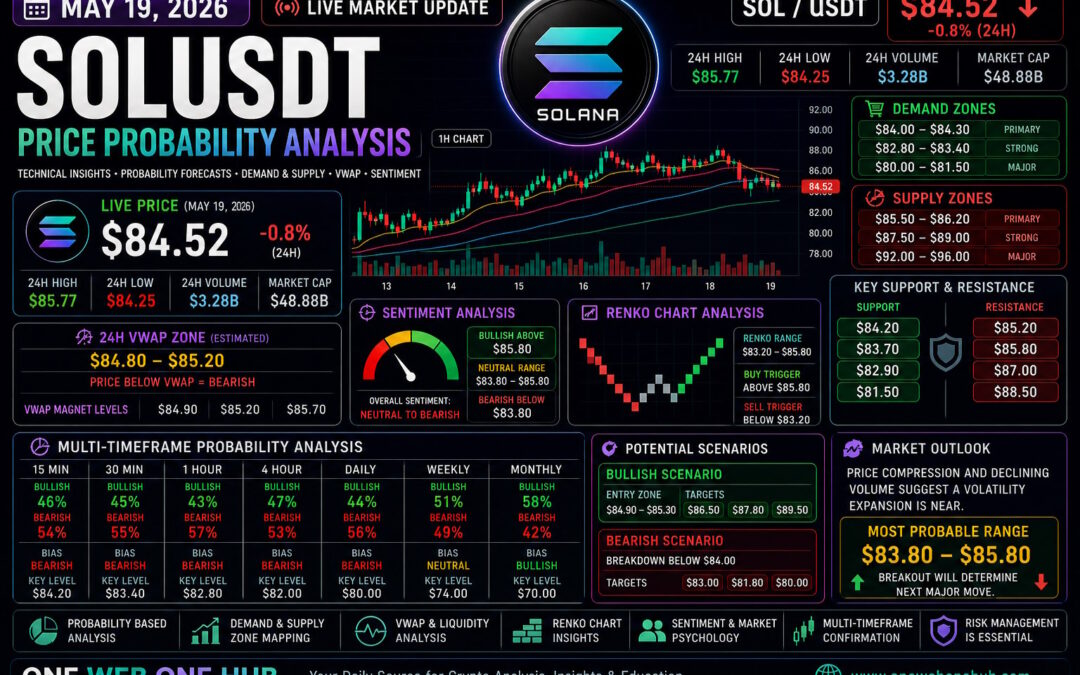
Latest market data from TradingView and CoinMarketCap shows SOLUSDT trading near:
- Current Price: $84.40 – $84.60
- 24H Change: -0.8% to -1.0%
- 24H High: $85.77
- 24H Low: $84.25
- 24H Volume: ~$3.28B
- Market Cap: ~$48.9B
The market structure currently reflects short-term weakness after rejection from higher resistance zones near $86.
Current Market Structure Analysis
Market Trend Overview
SOLUSDT has shifted into a temporary consolidation-to-bearish structure after failing to sustain bullish momentum above the $85.5 region.
Technical Conditions
- RSI near 42 → bearish-neutral momentum
- Stochastic RSI near oversold region
- Price trading below short-term moving averages
- Bollinger Band contraction visible
- Volume declining compared to previous bullish sessions
This setup often precedes either:
- A volatility expansion breakout
OR - A liquidity sweep before reversal.
Demand & Supply Zone Mapping
Immediate Demand Zones
Primary Demand Zone
- $84.00 – $84.30
Strong Demand Zone
- $82.80 – $83.40
Major Swing Demand
- $80.00 – $81.50
Immediate Supply Zones
Primary Supply Zone
- $85.50 – $86.20
Strong Supply Zone
- $87.50 – $89.00
Macro Supply Zone
- $92.00 – $96.00
Support & Resistance Levels
Key Support Levels
- $84.20
- $83.70
- $82.90
- $81.50
Key Resistance Levels
- $85.20
- $85.80
- $87.00
- $88.50
Probability Analysis Methodology
Probability Inputs Used
The directional forecasts below are generated using:
- Historical SOL volatility behavior
- Multi-timeframe trend structure
- Momentum oscillators (RSI/Stochastic RSI)
- Volume participation
- Liquidity zones and stop clusters
- VWAP approximation
- Support/resistance reaction frequency
- Crypto market sentiment and derivatives activity
These are probability-weighted scenarios, not guaranteed outcomes.
15-Minute Timeframe Analysis
Bullish Probability: 46%
If price reclaims $84.90:
Targets:
- $85.40
- $85.80
Bearish Probability: 54%
If support breaks below $84.20:
Targets:
- $83.70
- $83.20
Bias
Short-term bearish pressure remains slightly dominant.
30-Minute Timeframe Analysis
Bullish Probability: 45%
Break above VWAP region:
Targets:
- $85.70
- $86.20
Bearish Probability: 55%
Failure to hold $84:
Targets:
- $83.40
- $82.90
1-Hour Timeframe Analysis
Bullish Probability: 43%
Recovery structure possible only above $85.80.
Targets:
- $86.80
- $87.50
Bearish Probability: 57%
Continuation downside scenario:
Targets:
- $82.80
- $81.80
Bias
Intraday structure favors sellers unless reversal confirmation appears.
4-Hour Timeframe Analysis
Bullish Probability: 47%
Strong reversal requires reclaim of $87.
Targets:
- $89
- $92
Bearish Probability: 53%
Likely downside continuation toward:
- $82
- $80
Daily Timeframe Analysis
Bullish Probability: 44%
Daily bullish continuation only above $88.
Targets:
- $92
- $96
Bearish Probability: 56%
Macro correction scenario:
- $80
- $76
Weekly Timeframe Analysis
Bullish Probability: 51%
Longer-term SOL ecosystem strength remains intact.
Targets:
- $95
- $105
Bearish Probability: 49%
If broader altcoin weakness increases:
- $74
- $68
Monthly Timeframe Analysis
Bullish Probability: 58%
Long-term structure still favors recovery.
Targets:
- $110
- $130
- $150
Bearish Probability: 42%
Extended bearish macro scenario:
- $70
- $60
Renko Chart Analysis
Current Renko Structure
- Mixed bearish bricks dominating
- Momentum weakening after recent rejection
- Consolidation box forming near support
Renko Range
- $83.20 – $85.80
Renko Buy Trigger
Above $85.80:
Targets:
- $87.50
- $90.00
Renko Sell Trigger
Below $83.20:
Targets:
- $81.50
- $80.00
VWAP Analysis
Estimated 24H VWAP Zone
Based on current volume distribution and intraday structure:
- 24H VWAP Zone: $84.80 – $85.20
VWAP Interpretation
- Current price trading slightly below VWAP
- Sellers maintain mild intraday control
- Recovery above VWAP improves bullish odds significantly
VWAP Magnet Levels
- $84.90
- $85.20
- $85.70
Sentiment Analysis
Retail Sentiment
Cautiously bearish due to recent rejection.
Smart Money Perspective
Possible accumulation near low-$84 and upper-$83 zones.
Derivatives Insight
Leverage positioning appears balanced with slight short-term bearish bias.
Sentiment Price Ranges
Bullish Above
- $85.80
Neutral Range
- $83.80 – $85.80
Bearish Below
- $83.80
Liquidity & Hidden Market Insight
There is no verifiable “dark web” trading intelligence source. However, alternative market behavior indicators suggest:
- Whale activity increasing near demand zones
- Lower panic selling pressure
- Liquidity clustering near $83
- Potential short squeeze if $86 breaks
This supports a probable consolidation before the next major directional move.
Potential Trading Scenarios
Bullish Scenario
Entry Zone:
- $84.90 – $85.30
Targets:
- $86.50
- $87.80
- $89.50
Bearish Scenario
Breakdown Below:
- $84.00
Targets:
- $83.00
- $81.80
- $80.00
Final SOLUSDT Outlook for May 19, 2026
SOLUSDT currently sits in a critical decision zone. Price compression, declining volume, and weakening momentum suggest a breakout setup is approaching.
Most Probable Near-Term Scenario
- Consolidation between $83.80 and $85.80
- Followed by volatility expansion toward either:
- $87+ bullish breakout
OR - $82 downside liquidity sweep
- $87+ bullish breakout
The market remains highly reactive to Bitcoin and broader altcoin sentiment.
Educational Disclaimer
This article is for educational and informational purposes only and does not constitute financial advice, investment advice, or trading recommendations. Cryptocurrency markets are highly volatile and involve substantial risk. Always conduct your own research and use proper risk management before making investment decisions.
Discover More with One Web One Hub
19 May 2026 SOLUSDT FI (referral link)
Your Daily Source for Smarter Crypto Analysis
At One Web One Hub, we transform complex market movements into practical educational insights designed for traders, investors, and crypto enthusiasts.
Why Traders Follow One Web One Hub
- Daily crypto market forecasts
- Multi-timeframe technical analysis
- Probability-based trade scenarios
- Educational breakdowns for all experience levels
- Fast updates on major crypto assets
Stay Ahead of Market Moves
Whether you are a scalper, swing trader, or long-term investor, One Web One Hub helps you stay informed, prepared, and confident in rapidly changing crypto markets.
Visit daily for fresh insights, smarter strategies, and deeper market understanding.
Previous Post SOLUSDT – Probability Analysis For May 12, 2026


