ADAUSDT – Probability Analysis for May 04, 2026
ADAUSDT Price Analysis – May 04, 2026
Current Market Overview
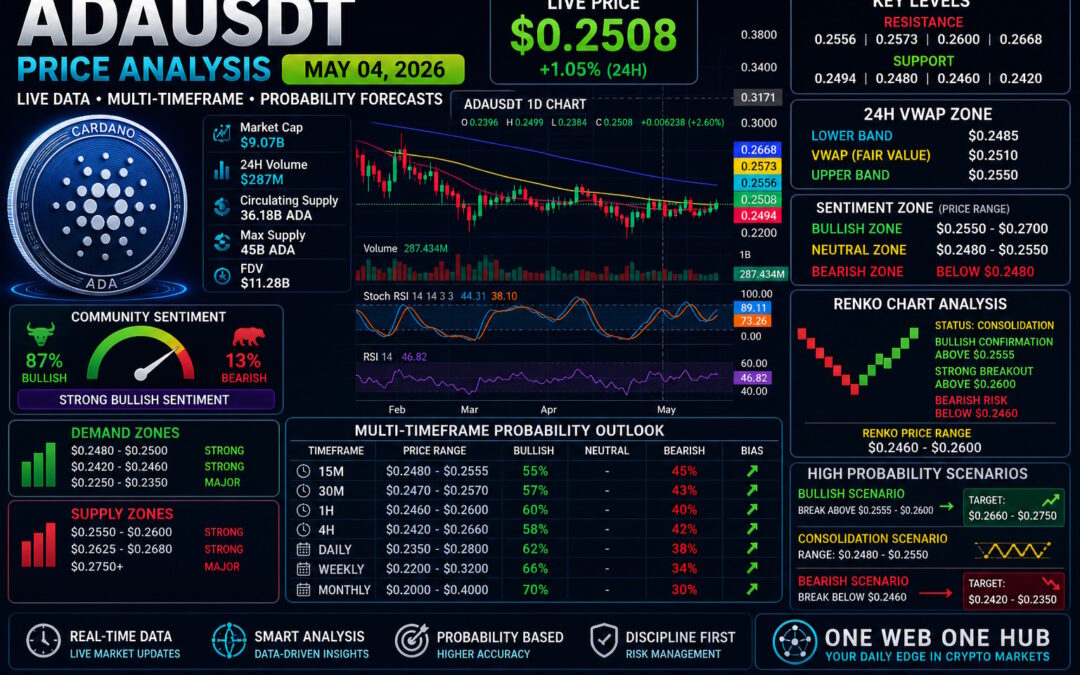
ADAUSDT is currently trading near $0.2508, showing a +1.05% gain in the last 24 hours. The market is demonstrating early signs of recovery after a prolonged consolidation phase, with buyers gradually stepping in at key levels.
Live Market Snapshot
-
Current Price: $0.2508
-
24H Change: +1.05%
-
24H Volume: ~$287M
-
Market Cap: ~$9.07B
-
Community Sentiment: 87% Bullish / 13% Bearish
The steady increase in price combined with strong sentiment suggests accumulation with potential upside continuation.
Market Structure Analysis
Short-Term Trend
On lower timeframes, ADA is ranging tightly between $0.2480 and $0.2550, indicating consolidation before a breakout.
Mid-Term Trend
The 4H structure shows sideways accumulation, with compression indicating a volatility expansion soon.
Long-Term Trend
Macro structure remains recovery-oriented, with ADA forming a base above the $0.24 region.
Demand and Supply Zones
Demand Zones
-
$0.2480 – $0.2500 → Immediate support
-
$0.2420 – $0.2460 → Strong demand zone
-
$0.2250 – $0.2350 → Institutional accumulation zone
Supply Zones
-
$0.2550 – $0.2600 → Immediate resistance
-
$0.2625 – $0.2680 → Strong supply zone
-
$0.2750+ → Macro resistance
Support and Resistance Levels
Support Levels
-
$0.2494
-
$0.2480
-
$0.2460
-
$0.2420
Resistance Levels
-
$0.2556
-
$0.2573
-
$0.2600
-
$0.2668
24H VWAP Analysis
Estimated VWAP Zone
-
Lower VWAP Band: $0.2485
-
VWAP Fair Value: $0.2510
-
Upper VWAP Band: $0.2550
VWAP Interpretation
-
Price near VWAP = Balanced market
-
Above $0.2550 = Bullish breakout
-
Below $0.2485 = Weakness
Currently, ADA is hovering around VWAP, signaling indecision before expansion.
Multi-Timeframe Price Probability Analysis
15-Minute Timeframe
Range
$0.2480 – $0.2555
Probability
-
Bullish: 55%
-
Bearish: 45%
Short-term bias slightly bullish.
30-Minute Timeframe
Range
$0.2470 – $0.2570
Probability
-
Bullish: 57%
-
Bearish: 43%
Gradual strength building.
1-Hour Timeframe
Range
$0.2460 – $0.2600
Probability
-
Bullish: 60%
-
Bearish: 40%
Compression suggests breakout potential.
4-Hour Timeframe
Range
$0.2420 – $0.2660
Probability
-
Bullish: 58%
-
Bearish: 42%
Trend neutral but leaning bullish.
Daily Timeframe
Range
$0.2350 – $0.2800
Probability
-
Bullish: 62%
-
Bearish: 38%
Recovery structure forming.
Weekly Timeframe
Range
$0.2200 – $0.3200
Probability
-
Bullish: 66%
-
Bearish: 34%
Accumulation phase intact.
Monthly Timeframe
Range
$0.2000 – $0.4000
Probability
-
Bullish: 70%
-
Bearish: 30%
Macro recovery trend continues.
Renko Chart Analysis
Renko Trend Status
Renko structure indicates sideways bricks transitioning into early bullish formation.
Key Renko Levels
-
Bullish Confirmation: Above $0.2555
-
Strong Breakout: Above $0.2600
-
Bearish Risk: Below $0.2460
Renko Price Range
$0.2460 – $0.2600
Renko suggests compression before breakout, favoring bulls slightly.
Sentiment Analysis
Market Sentiment
-
Bullish: 87%
-
Bearish: 13%
Interpretation
Strong bullish sentiment combined with consolidation indicates accumulation rather than distribution.
Sentiment Price Zones
-
Bullish Zone: $0.2550 – $0.2700
-
Neutral Zone: $0.2480 – $0.2550
-
Bearish Zone: Below $0.2480
Basis of Probability Analysis
Key Inputs
-
Live price structure from chart
-
RSI & momentum indicators
-
Moving averages alignment
-
Bollinger Band compression
-
Volume behavior
-
VWAP estimation
-
Renko trend structure
-
Sentiment data
-
Multi-timeframe confluence
Methodology
Probabilities are calculated by combining:
-
Trend strength
-
Level reactions
-
Indicator confluence
-
Market sentiment
This increases reliability compared to single-indicator strategies.
High Probability Trading Scenarios
Bullish Scenario
Break above $0.2555 – $0.2600
→ Target: $0.2660 – $0.2750
Consolidation Scenario
Range between $0.2480 – $0.2550
Bearish Scenario
Break below $0.2460
→ Target: $0.2420 – $0.2350
Trading Insight Summary
-
Market Phase: Accumulation
-
Bias: Slightly Bullish
-
Breakout Level: $0.2555
-
Breakdown Level: $0.2460
-
Strategy: Trade breakout or buy support
Disclaimer
This content is for educational purposes only and does not constitute financial advice. Cryptocurrency trading involves significant risk. Always conduct your own research before making any trading or investment decisions.
Please Follow & Support One Web One Hub – Your Daily Crypto Edge
04 May 2026 ADAUSDT FI (Referral Link)
Stay ahead of the market with One Web One Hub, your go-to platform for:
What You Get
-
Daily crypto price analysis
-
Multi-timeframe probability forecasts
-
Smart money concepts simplified
-
Consistent trading education
Why It Matters
Most traders fail due to lack of structured analysis. We provide clear, data-driven insights to help you make informed decisions.
Take Action
-
Bookmark the website
-
Visit daily for fresh insights
-
Share with your trading circle
Consistency in learning leads to consistency in results. Your journey to smarter trading starts here.
Previous Post ADAUSDT – Probability Analysis for Apr 27, 2026


