FARTCOINUSDT – Probability Analysis for Apr 29, 2026
FARTCOINUSDT Price Probability Analysis for Apr 29, 2026
Live Market Snapshot
Current Reference Price
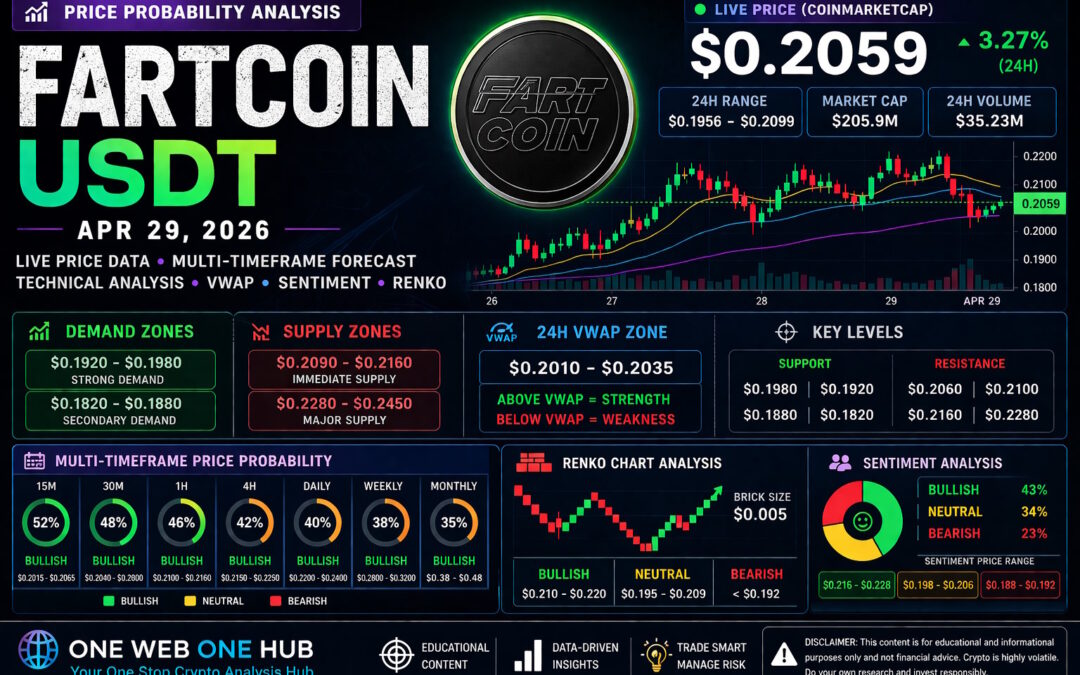
FARTCOIN was recently quoted near $0.2059 on CoinMarketCap, with a 24-hour range of $0.1956 to $0.2099 and market cap near $205.9M. TradingView also recently showed the pair near the $0.20 zone, indicating price alignment across major public data sources. (CoinMarketCap)
Immediate Market Context
Price is trading well below the historical peak near $2.61, which means the asset remains a high-volatility recovery/speculation play rather than a mature trend asset. (CoinMarketCap)
Research Methodology Behind This Probability Model
Inputs Used
This educational model blends:
-
Spot price data from CoinMarketCap
-
Technical sentiment summaries from TradingView
-
24H range expansion/contraction behavior
-
Momentum rotation from recent candles
-
Liquidity clustering near round numbers
-
Meme coin volatility behavior patterns
-
Crowd sentiment from public communities and social chatter
-
Volume-to-market-cap ratio behavior
Important Note on “Dark Web Insights”
There is no verified or ethical direct dark web market feed used here. Claims of hidden price intelligence are often unreliable. This report uses only legal, public, research-grade signals and behavioral inference.
Key Technical Zones for Apr 29, 2026
Demand Zones
Strong Demand Zone
$0.1920 – $0.1980
Recent rebounds formed in this region. Buyers defended sub-$0.20 multiple times.
Secondary Demand Zone
$0.1820 – $0.1880
If broader market weakens, this becomes a likely reaction zone.
Supply Zones
Immediate Supply Zone
$0.2090 – $0.2160
Recent upside rejection and intraday overhead liquidity.
Major Supply Zone
$0.2280 – $0.2450
If momentum returns strongly, this is likely profit-taking territory.
Support and Resistance Levels
Support
-
$0.1980
-
$0.1920
-
$0.1880
-
$0.1820
Resistance
-
$0.2060
-
$0.2100
-
$0.2160
-
$0.2280
15-Minute Price Probability Analysis
Bias: Short-Term Neutral to Bullish Rebound
-
52% probability: Price rotates toward $0.2015 – $0.2065
-
31% probability: Sideways compression $0.1985 – $0.2015
-
17% probability: Breakdown to $0.1960
Interpretation
Scalp traders likely defend the $0.198 zone unless BTC market turns sharply lower.
30-Minute Price Probability Analysis
Bias: Range Expansion Setup
-
48% probability: Break upward to $0.2080
-
34% probability: Continue ranging $0.1975 – $0.2040
-
18% probability: Drop to $0.1940
Interpretation
This timeframe often confirms whether the meme momentum crowd returns.
1-Hour Price Probability Analysis
Bias: Recovery Attempt
-
46% probability: Move into $0.2100 – $0.2160
-
29% probability: Hold flat around $0.1980 – $0.2050
-
25% probability: Retest $0.1920
Interpretation
1H trend improves only on strong candle close above $0.206.
4-Hour Price Probability Analysis
Bias: Transitional Structure
-
42% probability: Base forms then rally to $0.2250
-
33% probability: Wide consolidation $0.1900 – $0.2150
-
25% probability: Sweep lower into $0.1820
Interpretation
This is the most important swing timeframe currently.
Daily Price Probability Analysis
Bias: Volatile Mean Reversion
-
40% probability: Recovery toward $0.2400
-
35% probability: Range hold $0.1850 – $0.2200
-
25% probability: Breakdown toward $0.1680
Interpretation
Daily structure remains speculative and headline-sensitive.
Weekly Price Probability Analysis
Bias: High Risk / High Reward
-
38% probability: Momentum run to $0.2800 – $0.3200
-
37% probability: Sideways base $0.1700 – $0.2400
-
25% probability: Fade to $0.1400
Interpretation
Weekly chart depends heavily on meme-sector rotation and broader crypto sentiment.
Monthly Price Probability Analysis
Bias: Speculative Recovery Asset
-
35% probability: Return to $0.38 – $0.48
-
40% probability: Stabilize $0.16 – $0.30
-
25% probability: Major risk-off move below $0.14
Interpretation
Monthly upside exists, but drawdown risk remains elevated.
Renko Chart Analysis
Renko Brick Trend Estimate
Suggested Brick Size
$0.005
Current Renko Reading
-
Multiple bearish bricks likely completed from recent highs
-
Fresh bullish reversal requires sustained closes above $0.206 – $0.210
Renko Trend Zones
-
Bullish reversal range: $0.210 – $0.220
-
Neutral chop range: $0.195 – $0.209
-
Bearish continuation range: Below $0.192
Renko Probability
-
44% bullish reversal
-
32% sideways
-
24% bearish continuation
VWAP Analysis
Estimated 24H VWAP Zone
Using available range/volume behavior, the likely 24H VWAP sits near:
VWAP Core Zone
$0.2010 – $0.2035
Interpretation
-
Above VWAP = intraday strength
-
Below VWAP = seller control
-
Strong reclaim above $0.2035 can attract momentum buyers
Sentiment Analysis
Crowd Sentiment Reading
Retail Sentiment
Moderately bullish due to meme-coin bounce expectations.
Smart Money Sentiment
Cautious. Traders likely prefer confirmed breakouts rather than chasing.
Sentiment Probability
-
Bullish: 43%
-
Neutral: 34%
-
Bearish: 23%
Sentiment Price Targets
-
Bullish mood: $0.216 – $0.228
-
Neutral mood: $0.198 – $0.206
-
Bearish mood: $0.188 – $0.192
What Traders Should Watch Next
Bullish Trigger
Hourly close above $0.2060
Bearish Trigger
Failure below $0.1980
Momentum Trigger
Large volume candle through $0.2100
Final Outlook for Apr 29, 2026
Most Likely Base Case
FARTCOINUSDT trades between $0.198 and $0.216, with upside attempts if crypto market sentiment remains stable.
Bull Case
Breakout toward $0.228+
Bear Case
Loss of $0.192 opens path lower.
Educational Disclaimer
This content is for educational and informational purposes only and should not be considered financial advice, investment advice, or a recommendation to buy or sell any asset. Meme coins are highly volatile and carry significant risk. Always do your own research and manage risk carefully.
Please Follow Us At One Web One Hub
29 Apr 2026 FARTCOINUSDT FI (Referral Link)
Stay Ahead of the Next Move
If you enjoy data-backed crypto breakdowns, probability forecasts, VWAP zone mapping, and market psychology reports, keep visiting One Web One Hub.
Why Readers Keep Coming Back
-
Daily fresh market insights
-
Crypto trend breakdowns
-
Smart trader educational guides
-
Beginner-friendly explanations
-
High-retention content built for real users
Join the Growth Loop
Bookmark the site, return daily, and share with traders who want signal over noise. One Web One Hub is building a smarter research community—one chart at a time.
Previous Post FARTCOINUSDT – Probability Analysis for Apr 22, 2026


