XRPUSDT – Probability Analysis for Apr 26, 2026
XRPUSDT Price Analysis – April 26, 2026
Live Market Overview
Based on the latest XRPUSDT market snapshot from CoinMarketCap and TradingView:
-
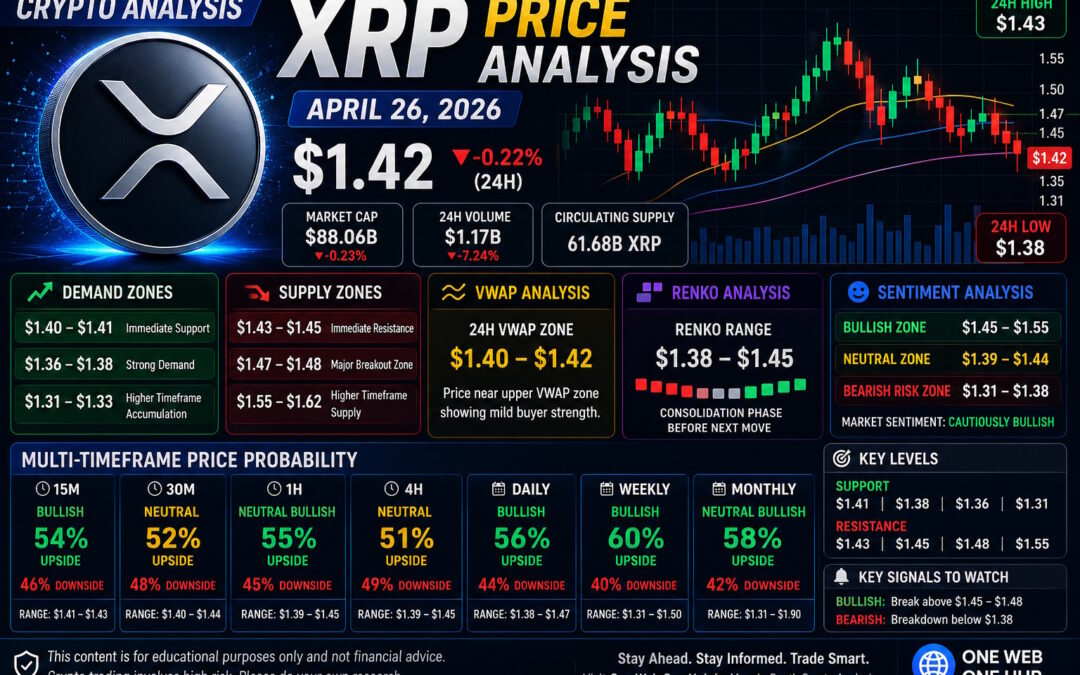
Current XRP Price: $1.42
-
24H Change: -0.22%
-
Intraday High: $1.43
-
Intraday Low: $1.38
-
Market Cap: $88.06B
-
24H Volume: $1.17B
-
RSI: 54.84
-
Stochastic RSI: 48.32
XRP is currently trading in a balanced consolidation phase, hovering near short-term moving averages while the market waits for a directional catalyst.
Current Market Structure
Short-Term Trend
-
Price rebounded from $1.38 support.
-
Consolidation visible between $1.40 and $1.43.
-
Buyers and sellers remain evenly matched.
This suggests a neutral intraday structure with breakout potential.
Higher Timeframe Context
-
XRP remains below the macro resistance zone near $1.47–$1.48.
-
Weekly structure still constructive above $1.31.
-
Market momentum remains compressed.
Overall structure is neutral with slight bullish undertone.
Demand and Supply Zones
Major Demand Zones
$1.40 – $1.41
Immediate support zone.
$1.36 – $1.38
Strong reaction demand zone.
$1.31 – $1.33
Higher timeframe accumulation area.
Major Supply Zones
$1.43 – $1.45
Immediate resistance cluster.
$1.47 – $1.48
Major breakout barrier.
$1.55 – $1.62
Higher timeframe supply zone.
Support and Resistance Levels
Key Support Levels
-
$1.41
-
$1.38
-
$1.36
-
$1.31
Key Resistance Levels
-
$1.43
-
$1.45
-
$1.48
-
$1.55
A breakout above $1.48 may trigger stronger bullish momentum.
24-Hour VWAP Analysis
Estimated VWAP Zone
$1.40 – $1.42
Interpretation
-
Price above VWAP = bullish control
-
Price below VWAP = bearish pressure
-
Price near VWAP = equilibrium / sideways action
Current XRP price is trading near the upper edge of VWAP, indicating mild buyer strength.
Renko Chart Analysis
Current Renko Structure
-
Alternating bricks show consolidation.
-
Recent green bricks suggest buyers defending support.
-
No confirmed trend expansion yet.
Renko Price Range
$1.38 – $1.45
Key Renko Signals
Bullish breakout trigger:
Above $1.45
Bearish breakdown trigger:
Below $1.38
Renko structure indicates a compression phase before the next larger move.
Multi-Timeframe Price Probability Analysis
Probabilities are based on:
-
Trend momentum
-
RSI/Stochastic behavior
-
Volume profile
-
VWAP position
-
Support/resistance reaction
-
Renko structure
15-Minute Timeframe
Bias: Neutral-Bullish
-
Upside Probability: 54%
-
Downside Probability: 46%
Expected Range: $1.41 – $1.43
30-Minute Timeframe
Bias: Neutral
-
Upside Probability: 52%
-
Downside Probability: 48%
Expected Range: $1.40 – $1.44
1-Hour Timeframe
Bias: Neutral-Bullish
-
Upside Probability: 55%
-
Downside Probability: 45%
Expected Range: $1.39 – $1.45
4-Hour Timeframe
Bias: Neutral
-
Upside Probability: 51%
-
Downside Probability: 49%
Expected Range: $1.38 – $1.47
Daily Timeframe
Bias: Bullish
-
Upside Probability: 56%
-
Downside Probability: 44%
Expected Range: $1.35 – $1.50
Weekly Timeframe
Bias: Bullish
-
Upside Probability: 60%
-
Downside Probability: 40%
Expected Range: $1.31 – $1.62
Monthly Timeframe
Bias: Neutral-Bullish
-
Upside Probability: 58%
-
Downside Probability: 42%
Expected Range: $1.10 – $1.90
Sentiment Analysis
Market Sentiment Overview
Current sentiment is cautiously bullish because:
-
Price remains above major supports.
-
Repeated dips are being bought.
-
Market cap remains strong.
-
Traders are waiting for breakout confirmation.
Sentiment Price Ranges
Bullish Zone:
$1.45 – $1.55
Neutral Zone:
$1.39 – $1.44
Bearish Risk Zone:
$1.31 – $1.38
Basis of Probability Calculations
This framework uses:
Price Action Structure
Trend continuation and rejection zones.
Volume Analysis
Buying/selling pressure levels.
Momentum Indicators
RSI and Stochastic rotation signals.
VWAP Positioning
Institutional intraday bias.
Renko Confirmation
Trend clarity without candle noise.
Historical Reaction Zones
Repeated market responses.
These inputs create scenario probabilities rather than certainty.
Key Signals to Watch
Bullish Signals
-
Break above $1.45
-
Strong close above $1.48
-
Sustained price above VWAP
Bearish Signals
-
Rejection at $1.43 – $1.45
-
Breakdown below $1.38
-
Weakening volume on rallies
Please Follow And Bookmark To Continue Learning With One Web One Hub
26 Apr 2026 XRPUSDT FI (Referral Link)
If you enjoy structured crypto market analysis, One Web One Hub helps traders stay informed with clear and practical insights.
What readers gain:
-
Weekly XRP price analysis
-
Real market breakdowns
-
Beginner-friendly technical education
-
Smart money concepts simplified
-
Higher confidence decision frameworks
Keep learning and stay ahead with One Web One Hub.
Educational Disclaimer
This content is for educational and informational purposes only and does not constitute financial advice.
Cryptocurrency markets are volatile and risky. Always conduct your own research and consult a qualified financial advisor before making investment decisions.
Previous Post XRPUSDT – Probability Analysis for Apr 19, 2026
Next Post XRPUSDT – Probability Analysis for May 03, 2026


