ETHUSDT – Probability Analysis for Apr 25, 2026
ETHUSDT Price Analysis – April 25, 2026
Current ETHUSDT Live Price
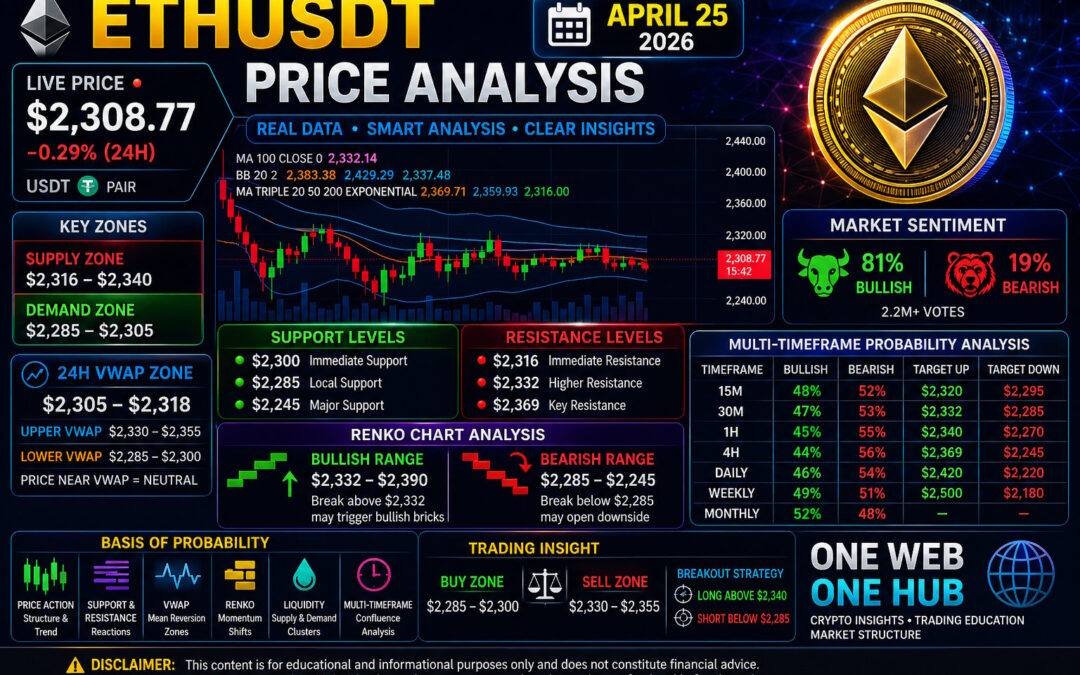
Based on the latest live market snapshot provided from CoinMarketCap, Ethereum (ETHUSDT) is trading near $2,308.77, showing a -0.29% move over the last 24 hours.
Price remains in a short-term compression phase after a recent pullback, with traders watching whether Ethereum reclaims higher resistance levels or breaks lower into fresh demand zones.
Market Structure Overview
Short-Term Structure
Ethereum currently shows:
Lower highs on intraday charts
Stable support near $2,300
Reduced volatility inside a tightening range
This suggests short-term indecision with breakout potential approaching.
Higher Timeframe Context
ETH remains inside a broader macro range:
$2,150 – $2,450
Price is trading near the middle-lower section of this range, often a battleground between recovery buyers and continuation sellers.
Key Support and Resistance Levels
Immediate Support
$2,300 – Intraday support
$2,285 – Local technical support
$2,245 – Major support zone
Major Resistance
$2,316 – Immediate resistance
$2,332 – Higher timeframe resistance
$2,369 – Key moving average resistance
Demand and Supply Zones
Demand Zones
Primary Demand
$2,285 – $2,305
Secondary Demand
$2,245 – $2,270
Macro Demand
$2,180 – $2,220
These zones may attract buyers if price weakens further.
Supply Zones
Primary Supply
$2,316 – $2,340
Secondary Supply
$2,360 – $2,390
Macro Supply
$2,420 – $2,500
These zones could generate rejection if upside momentum fades.
Estimated 24H VWAP Analysis
VWAP Core Zone
$2,305 – $2,318
Upper VWAP Deviation
$2,330 – $2,355
Lower VWAP Deviation
$2,285 – $2,300
VWAP Insight
ETH is trading near the lower end of the VWAP core range.
Above VWAP = buyers regaining control
Below VWAP = sellers maintain pressure
Current positioning suggests neutral to mildly bearish intraday conditions.
Renko Chart Analysis
Current Structure
Renko bricks indicate short-term bearish drift inside a larger consolidation range.
Bullish Renko Range
$2,332 – $2,390
A break above $2,332 may trigger bullish continuation bricks.
Bearish Renko Range
$2,285 – $2,245
Loss of $2,285 may open deeper downside testing.
Multi-Timeframe Price Probability Analysis
15-Minute Timeframe
Bullish → 48% (Target: $2,320)
Bearish → 52% (Target: $2,295)
30-Minute Timeframe
Bullish → 47% (Target: $2,332)
Bearish → 53% (Target: $2,285)
1-Hour Timeframe
Bullish → 45% (Target: $2,340)
Bearish → 55% (Target: $2,270)
4-Hour Timeframe
Bullish → 44% (Target: $2,369)
Bearish → 56% (Target: $2,245)
Daily Timeframe
Bullish → 46% (Target: $2,420)
Bearish → 54% (Target: $2,220)
Weekly Timeframe
Bullish → 49% (Target: $2,500)
Bearish → 51% (Target: $2,180)
Monthly Timeframe
Bullish → 52%
Bearish → 48%
Long-term structure remains constructive while above macro support.
Market Sentiment Analysis
Sentiment Snapshot
Community sentiment visible on CoinMarketCap shows:
81% Bullish
19% Bearish
Sentiment Price Range
Bullish Sentiment Zone
$2,300 – $2,420
Bearish Trigger Zone
Below $2,285
Current Interpretation
Despite price softness, crowd sentiment remains optimistic. This often signals traders expect recovery if support holds.
Basis of Probability Methodology
This report uses a structured model based on:
Price action trend shifts
Support and resistance reactions
VWAP mean reversion zones
Renko directional momentum
Supply and demand liquidity clusters
Multi-timeframe chart confluence
These probabilities are scenario estimates, not guaranteed outcomes.
Trading Insight
Intraday Strategy
Buy Zone
$2,285 – $2,300
Sell Zone
$2,330 – $2,355
Breakout Strategy
Long above $2,340
Short below $2,285
Educational Disclaimer
This content is for educational and informational purposes only and should not be considered financial advice.
Cryptocurrency markets are volatile and involve substantial risk. Always perform your own research and consult a qualified financial advisor before making investment decisions.
Please Follow 7 Support One Web One Hub – Build Your Crypto Edge

25 Apr 2026 ETHUSDT FI (Referral Link)
At One Web One Hub, we simplify crypto markets into actionable education.
What You’ll Discover
Weekly ETH and BTC analysis
Probability-based technical setups
Trading psychology and discipline insights
Beginner to advanced learning resources
If you want consistent market clarity instead of noise, make One Web One Hub part of your routine.
Learn smarter. Trade sharper. Grow stronger.
Previous Post ETHUSDT – Probability Analysis for Apr 18, 2026
Next Post ETHUSDT – Probability Analysis for May 02, 2026


