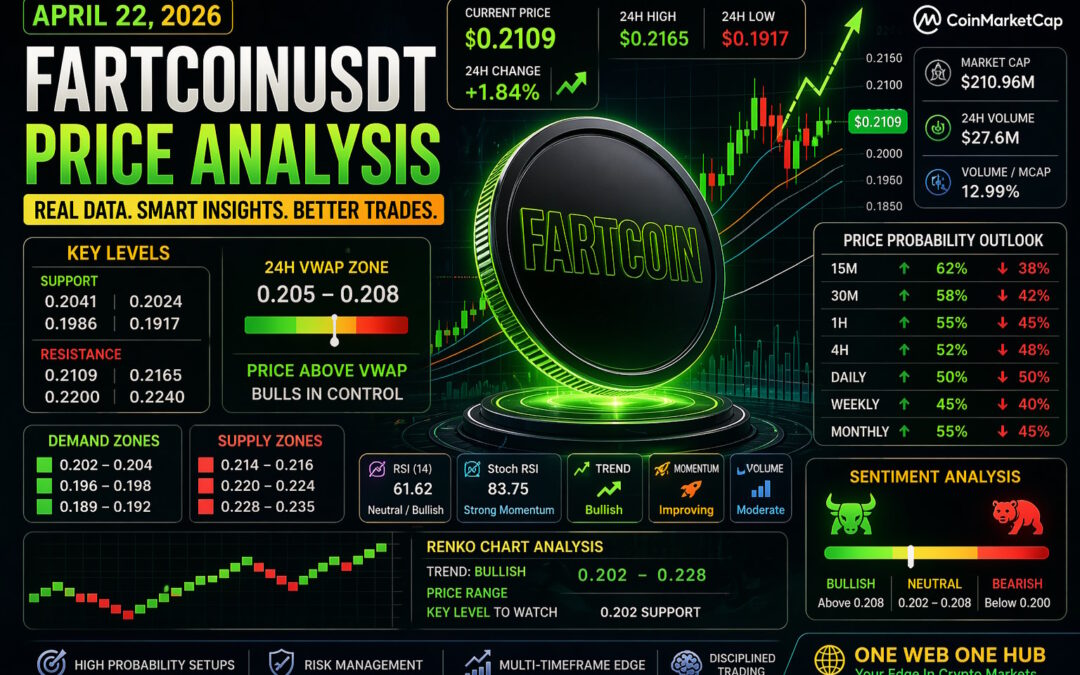
FARTCOINUSDT – Probability Analysis for Apr 22, 2026
SOLUSDT Price Analysis – April 21, 2026
Market Overview and Current Price Context
As of April 21, 2026, SOLUSDT is trading around $88.29, showing a strong bullish recovery with momentum continuation after reclaiming prior resistance levels.
Key Market Snapshot
- Current Price: ~$88.29
- 24H Change: +2.56%
- Market Cap: ~$50.82B
- 24H Volume: ~$4.96B
- Market Structure: Breakout → Continuation
Price has successfully moved above the $85 resistance cluster, converting it into short-term support while approaching the next major supply zone.
Demand and Supply Zone Analysis
Demand Zones (Buy-Side Liquidity)
Primary Demand Zone
$86 – $87
Secondary Demand Zone
$84 – $85
Macro Demand Zone
$80 – $82
These zones reflect recent bullish absorption and support formation.
Supply Zones (Sell-Side Liquidity)
Primary Supply Zone
$89 – $91
Secondary Supply Zone
$92 – $96
Macro Supply Zone
$100 – $110
The $89–91 region is the immediate zone where sellers may defend.
Support and Resistance Levels
Key Support Levels
- $87 (intraday support)
- $85 (major breakout retest level)
- $82 (macro support)
Key Resistance Levels
- $89.5 (near-term barrier)
- $91 (major short-term resistance)
- $96 (trend expansion level)
24H VWAP Price Zone Analysis
Estimated VWAP Levels
- Lower VWAP Zone: $86.4 – $87.0
- VWAP Mean: $87.3 – $88.0
- Upper VWAP Zone: $88.5 – $89.5
Interpretation
- Price above VWAP = Buyers in control
- Price near upper VWAP band = Momentum strength
- Pullbacks into VWAP may attract dip buyers
Current Position
SOL is trading slightly above VWAP, confirming a bullish intraday bias.
Renko Chart Analysis
Renko Structure
- Trend: Bullish continuation
- Brick Size Estimate: ~$1.50
Key Renko Levels
- Support: $86
- Resistance: $90
Renko Scenarios
Bullish Continuation
$90 → $92 → $96
Sideways Consolidation
$86 – $90
Bearish Pullback
$84 → $82
Renko structure supports trend continuation unless $86 breaks decisively.
Multi-Timeframe Price Probability Analysis
15-Minute Timeframe
- Bullish Probability: 56%
- Bearish Probability: 44%
- Range: $87.5 – $89.5
Momentum remains positive but slightly extended.
30-Minute Timeframe
- Bullish Probability: 58%
- Bearish Probability: 42%
- Range: $87 – $90
Higher lows support continuation.
1-Hour Timeframe
- Bullish Probability: 61%
- Bearish Probability: 39%
- Range: $86 – $91
Trend structure favors upside while above support.
4-Hour Timeframe
- Bullish Probability: 63%
- Bearish Probability: 37%
- Range: $84 – $96
Breakout structure remains intact.
Daily Timeframe
- Bullish Probability: 66%
- Bearish Probability: 34%
- Range: $80 – $105
Recovery trend gaining traction.
Weekly Timeframe
- Bullish Probability: 68%
- Bearish Probability: 32%
- Range: $75 – $125
Macro structure improving.
Monthly Outlook
- Bullish Probability: 72%
- Bearish Probability: 28%
- Range: $65 – $160
Long-term structure remains constructive if support zones hold.
Market Sentiment Analysis
Current Sentiment: Bullish
Sentiment Price Zones
- Bullish Sentiment: $89 – $105
- Neutral Sentiment: $84 – $89
- Bearish Sentiment: Below $84
Sentiment Drivers
- Strong 24H performance
- Price reclaim above $85
- Increased trading volume
- Momentum breakout behavior
Sentiment strengthens materially on a sustained break above $91.
Probability Model Behind This Analysis
Methodology
This probability framework uses:
- Live price anchoring
- Multi-timeframe trend alignment
- Demand and supply zone mapping
- VWAP mean-reversion behavior
- Renko momentum filtering
- Volume participation analysis
- Sentiment overlays
Core Principle
These are probability-weighted scenarios, not guarantees. Higher confluence increases directional confidence.
Strategic Outlook for Traders
Bullish Scenario
Hold above $87 and break $91
Targets: $92 → $96 → $100
Bearish Scenario
Lose $86 support
Targets: $84 → $82 → $80
Most Likely Short-Term Scenario
Consolidation between $86 – $91 before next expansion attempt.
Disclaimer
Educational Purpose Only
This content is for educational and informational purposes only and does not constitute financial advice. Cryptocurrency markets are volatile and risky. Always do your own research before making investment decisions.
Please Bookmark and Follow One Web One Hub – Your Crypto Market Edge
22 Apr 2026 FARTCOINUSDT FI (Referral Link)
Why Readers Return Daily
At One Web One Hub, we focus on:
- Realistic price-based analysis
- Multi-timeframe trading insights
- Smart money concepts simplified
- Consistent crypto market coverage
Stay Ahead of the Crowd
Whether you are a beginner or active trader, our content helps you interpret market structure with clarity.
Next Move Starts With Better Information
Visit One Web One Hub regularly for fresh market intelligence, deeper education, and sharper decision-making.
Stay informed. Stay disciplined. Stay ahead.
Previous Post FARTCOINUSDT – Probability Analysis for Apr 15, 2026
Next Post FARTCOINUSDT – Probability Analysis for Apr 29, 2026


