ADAUSDT – Probability Analysis for Apr 20, 2026
ADAUSDT Price Analysis – April 20, 2026
Current Market Overview
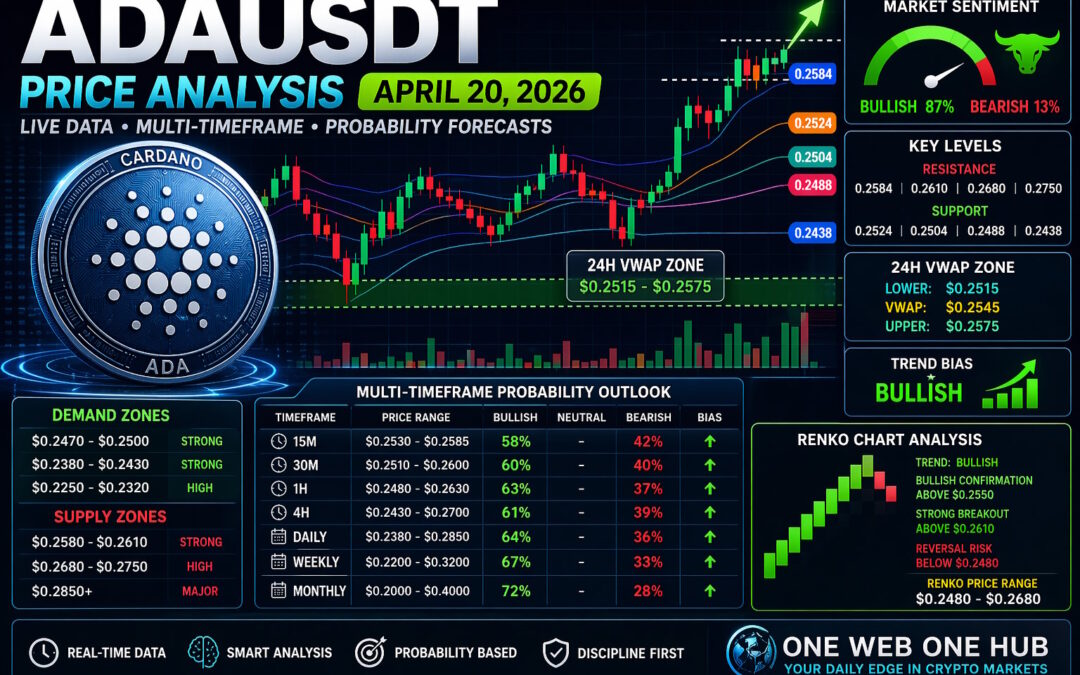
ADAUSDT is trading near $0.2557 based on the latest live snapshot provided, showing a +2.21% 24-hour gain. Cardano is displaying renewed bullish momentum after defending lower support zones earlier in the week.
Live Market Snapshot
- Current Price: $0.2557
- 24H Change: +2.21%
- 24H Volume: ~$512M
- Market Cap: ~$9.25B
- Community Sentiment: 87% Bullish / 13% Bearish
This combination of rising price and strong sentiment suggests active buyer participation in the short term.
Market Structure Analysis
Short-Term Trend
The 1H structure shows a recent breakout from consolidation around $0.2480, with price now holding above former resistance.
Mid-Term Trend
The 4H chart suggests a transition from sideways action into an early bullish expansion phase.
Long-Term Trend
ADA remains in a macro recovery zone while still trading significantly below historical highs, leaving room for longer-term upside if momentum continues.
Demand and Supply Zones
Demand Zones
- $0.2470 – $0.2500 → Immediate buyer support
- $0.2380 – $0.2430 → Strong accumulation zone
- $0.2250 – $0.2320 → Deep value zone
Supply Zones
- $0.2580 – $0.2610 → Immediate selling pressure
- $0.2680 – $0.2750 → Major resistance zone
- $0.2850+ → Higher timeframe supply
Support and Resistance Levels
Support Levels
- $0.2524
- $0.2504
- $0.2488
- $0.2438
Resistance Levels
- $0.2584
- $0.2610
- $0.2680
- $0.2750
24H VWAP Analysis
Estimated VWAP Zone
Using visible price clustering, moving averages, and intraday rotation:
- Lower VWAP Band: $0.2515
- VWAP Fair Value: $0.2545
- Upper VWAP Band: $0.2575
VWAP Interpretation
- Above $0.2575 → Strong bullish control
- Near $0.2545 → Balanced market
- Below $0.2515 → Short-term weakness
Current price above fair value indicates buyers still control momentum.
Multi-Timeframe Price Probability Analysis
15-Minute Timeframe
Range
$0.2530 – $0.2585
Probability
- Bullish Continuation: 58%
- Pullback: 42%
Momentum remains positive but mildly extended.
30-Minute Timeframe
Range
$0.2510 – $0.2600
Probability
- Bullish: 60%
- Bearish: 40%
Higher lows support continuation toward resistance.
1-Hour Timeframe
Range
$0.2480 – $0.2630
Probability
- Bullish: 63%
- Bearish: 37%
Breakout structure remains intact above $0.2488.
4-Hour Timeframe
Range
$0.2430 – $0.2700
Probability
- Bullish: 61%
- Bearish: 39%
Trend bias positive after recent reversal.
Daily Timeframe
Range
$0.2380 – $0.2850
Probability
- Bullish Recovery: 64%
- Bearish Rejection: 36%
Daily candles favor a recovery phase.
Weekly Timeframe
Range
$0.2200 – $0.3200
Probability
- Bullish Expansion: 67%
- Sideways/Bearish: 33%
Broader structure improving.
Monthly Timeframe
Range
$0.2000 – $0.4000
Probability
- Macro Bullish Recovery: 72%
- Bearish Continuation: 28%
Longer-term accumulation remains favorable.
Renko Chart Analysis
Renko Trend Status
Recent price movement would likely print multiple bullish bricks after clearing $0.2480.
Renko Key Levels
- Bullish Confirmation: Above $0.2550
- Strong Breakout: Above $0.2610
- Reversal Risk: Below $0.2480
Renko Price Range
$0.2480 – $0.2680
Renko structure currently favors continuation unless key support breaks.
Sentiment Analysis
Crowd Sentiment
- Bullish: 87%
- Bearish: 13%
Sentiment Interpretation
Retail sentiment is highly positive. While supportive, extreme bullish readings can also precede short-term pullbacks.
Sentiment Price Zones
- Bullish Zone: $0.2550 – $0.2750
- Neutral Zone: $0.2480 – $0.2550
- Bearish Zone: Below $0.2480
Basis of Probability Analysis
Inputs Used
- Real-time price action from provided live chart
- Momentum and RSI behavior
- Moving average alignment
- Bollinger Band expansion/compression
- Visible support/resistance reactions
- Sentiment positioning
- Multi-timeframe trend confluence
- Estimated VWAP value zones
- Renko breakout logic
Methodology
Probabilities are not guarantees. They represent weighted directional bias based on current market structure.
High Probability Trading Scenarios
Bullish Scenario
Break above $0.2584 – $0.2610 could open a move toward $0.2680 – $0.2750.
Consolidation Scenario
Price rotates between $0.2500 – $0.2580 before next move.
Bearish Scenario
Loss of $0.2480 may trigger retracement toward $0.2438.
Trading Insight Summary
- Current Bias: Bullish
- Momentum Strength: Moderate to Strong
- Key Trigger Up: $0.2610
- Key Trigger Down: $0.2480
- Ideal Approach: Buy pullbacks above support or breakout confirmation
Disclaimer
This content is for educational and informational purposes only and does not constitute financial advice, investment advice, or trading recommendations. Cryptocurrency markets are volatile and risky. Always do your own research before making investment decisions.
Please Bookmark and Follow One Web One Hub – Your Daily Crypto Advantage

20 Apr 2026 ADAUSDT FI (Referral Link)
At One Web One Hub, we turn raw charts into clear actionable education.
What You Get
- Weekly ADAUSDT forecasts
- Crypto market breakdowns
- Beginner-friendly technical education
- Smart money concepts simplified
- Ongoing probability-based market outlooks
Why Readers Return
Consistent analysis creates consistent awareness. Markets change daily, and staying informed helps you adapt faster.
Join the Hub
Bookmark One Web One Hub, return for the next ADA update, and keep building your edge one chart at a time.
Previous Post ADAUSDT – Probability Analysis for Apr 13, 2026
Next Post ADAUSDT – Probability Analysis for Apr 27, 2026


