SOLUSDT – Probability Analysis For Apr 19, 2026
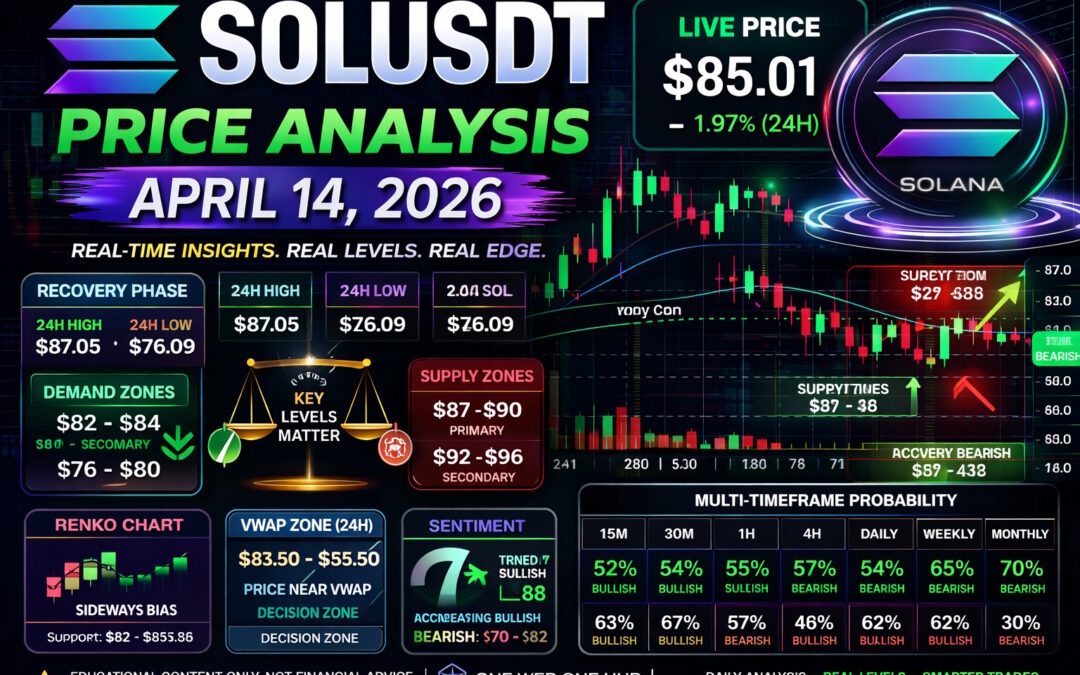
SOLUSDT Price Analysis – April 14, 2026
Market Overview and Current Price Context
As of April 14, 2026, SOLUSDT is trading around $85.0, showing a short-term recovery after consolidation near $78–$80 support zones.
Key Observations
- Current Price: ~$85
- Recent Low: ~$76
- Recent High: ~$87–$90 rejection zone
- Market Phase: Accumulation → Early Recovery
Price has successfully moved above the $82 resistance, now acting as short-term support.
Demand and Supply Zone Analysis
Demand Zones (Buy-Side Liquidity)
Primary Demand Zone
$82 – $84
Secondary Demand Zone
$76 – $80
Macro Demand Zone
$70 – $75
These zones reflect institutional accumulation and strong buyer reactions.
Supply Zones (Sell-Side Liquidity)
Primary Supply Zone
$87 – $90
Secondary Supply Zone
$92 – $96
Macro Supply Zone
$100 – $110
The $87–90 zone is currently acting as a key rejection area.
Support and Resistance Levels
Key Support Levels
- $84 (immediate support)
- $82 (structure base)
- $78 (strong demand)
Key Resistance Levels
- $87 (intraday resistance)
- $90 (major breakout level)
- $96 (trend confirmation level)
24H VWAP Price Zone Analysis
Estimated VWAP Levels
- Lower VWAP Zone: $83 – $84
- VWAP Mean: $84.5 – $85.5
- Upper VWAP Zone: $86 – $88
Interpretation
- Price near VWAP → Balanced market
- Holding above VWAP → Bullish continuation potential
- Rejection from VWAP → Return to demand zones
Current Position
SOL is trading at VWAP equilibrium, signaling a decision zone before expansion.
Renko Chart Analysis (Trend Confirmation)
Renko Structure
- Trend: Sideways → Bullish Shift
- Brick Size Estimate: ~$2
Key Renko Levels
- Support: $82
- Resistance: $88
Renko Scenarios
Bullish Continuation
$88 → $92 → $96
Sideways Range
$82 – $88
Bearish Breakdown
$80 → $76
Renko confirms momentum building but not yet fully confirmed.
Multi-Timeframe Price Probability Analysis
15-Minute Timeframe
- Bullish Probability: 52%
- Bearish Probability: 48%
- Range: $84 – $87
Short-term structure shows higher lows forming.
30-Minute Timeframe
- Bullish Probability: 55%
- Bearish Probability: 45%
- Range: $83 – $88
Momentum building toward resistance.
1-Hour Timeframe
- Bullish Probability: 57%
- Bearish Probability: 43%
- Range: $82 – $90
Structure shifting toward bullish recovery.
4-Hour Timeframe
- Bullish Probability: 60%
- Bearish Probability: 40%
- Range: $80 – $96
Clear accumulation transitioning into expansion.
Daily Timeframe
- Bullish Probability: 62%
- Bearish Probability: 38%
- Range: $75 – $110
Trend slowly turning bullish after correction.
Weekly Timeframe
- Bullish Probability: 65%
- Bearish Probability: 35%
- Range: $70 – $130
Macro structure remains constructive.
Monthly Outlook
- Bullish Probability: 70%
- Bearish Probability: 30%
- Range: $60 – $160
Long-term outlook remains bullish with accumulation base forming.
Market Sentiment Analysis
Current Sentiment: Neutral to Bullish
Sentiment Price Zones
- Bullish Sentiment: $88 – $110
- Neutral Zone: $82 – $88
- Bearish Zone: $70 – $82
Sentiment Drivers
- Recovery from key demand zones
- Increasing volume near support
- Resistance still capping upside
Sentiment will turn strongly bullish only after $90 breakout.
Probability Model Behind This Analysis
Methodology
This analysis is based on:
- Market structure (trend + consolidation)
- Liquidity zones (demand/supply clusters)
- VWAP deviation modeling
- Renko trend filtering
- Volume and volatility behavior
- Sentiment alignment
Core Principle
This is probability-based analysis, not prediction.
Each scenario reflects likelihood based on confluence of signals.
Strategic Outlook for Traders
Bullish Scenario
- Break above $88
- Targets: $92 → $96 → $100
Bearish Scenario
- Lose $82 support
- Targets: $80 → $76
Most Likely Scenario (Short-Term)
- Range-bound movement between $82 – $88
- Ideal for scalping and short-term trading
Disclaimer
Educational Purpose Only
This content is for educational and informational purposes only and does not constitute financial advice. Cryptocurrency trading involves high risk. Always perform your own research before making any financial decisions.
Please Follow & Support One Web One Hub – Your Crypto Edge
14 Apr 2026 SOLUSDT FI (Referral Link)
Why This Platform Stands Out
At One Web One Hub, we provide:
- Real price-based analysis (no unrealistic projections)
- Multi-timeframe probability breakdowns
- Advanced tools like VWAP & Renko simplified
- Consistent daily insights
Stay Ahead of the Market
If you want to trade smarter:
- Follow daily analysis
- Understand real market structure
- Build confidence with data-driven insights
Your Next Step
Don’t just read the market — understand it.
Visit One Web One Hub and turn knowledge into your trading advantage.
Previous Post SOLUSDT – Probability Analysis For Apr 07, 2026
Next Post SOLUSDT – Probability Analysis For Apr 21, 2026


