XRPUSDT – Probability Analysis for Apr 12, 2026
XRPUSDT Price Analysis — April 12, 2026
Live Market Overview
Based on the latest chart data provided:
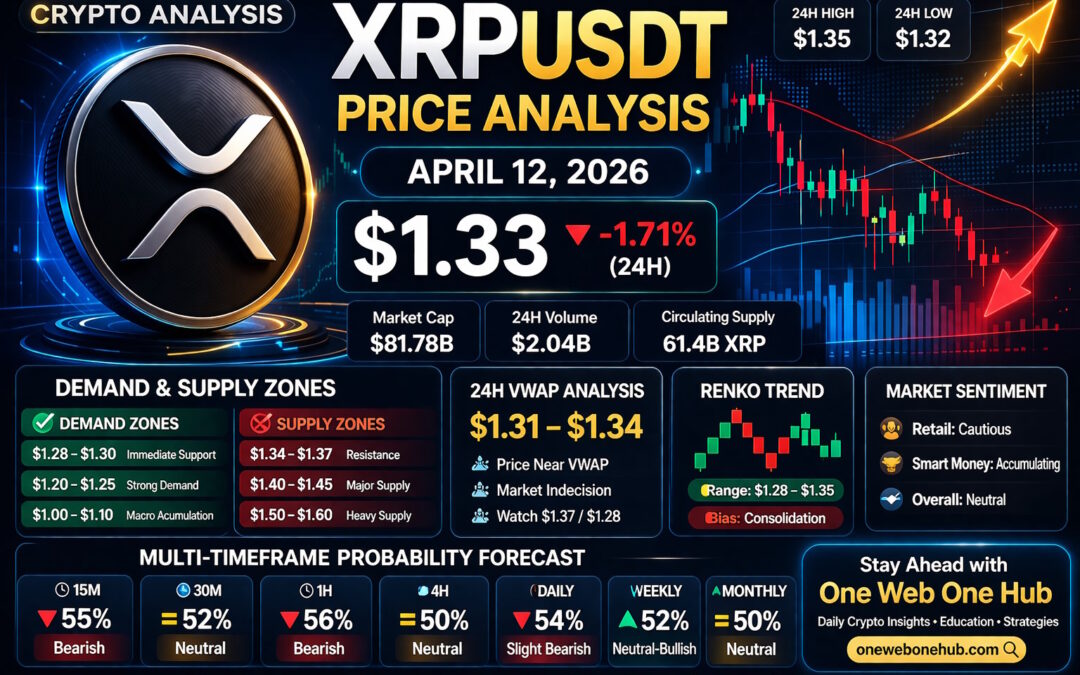
- Current Price: $1.33
- 24H Change: -1.71%
- Intraday High: $1.35
- Intraday Low: $1.32
- Market Cap: ~$81.78B
- 24H Volume: ~$2.04B
XRP is currently trading in a tight consolidation range, showing signs of indecision after a minor recovery attempt, with price hovering just above key short-term support.
Current Market Structure
Short-Term Trend
- Sideways consolidation with slight bearish pressure
- Lower highs visible on intraday charts
- Weak bullish follow-through
This indicates a range-bound market with a bearish tilt.
Higher Timeframe Context
- Price remains below key resistance at $1.37
- Strong support forming near $1.28–$1.30
Overall structure remains neutral to bearish until breakout confirmation.
Demand and Supply Zones
Major Demand Zones
$1.28 – $1.30
Immediate support where buyers are stepping in.
$1.20 – $1.25
Strong demand and accumulation zone.
$1.00 – $1.10
Macro support level.
Major Supply Zones
$1.34 – $1.37
Immediate resistance zone.
$1.40 – $1.45
Major supply cluster.
$1.50 – $1.60
Higher timeframe resistance.
Support and Resistance Levels
Key Support
- $1.30
- $1.28
- $1.25
- $1.20
Break below $1.28 could trigger a sharp move lower.
Key Resistance
- $1.34
- $1.37
- $1.40
- $1.45
Break above $1.37 is required for bullish momentum.
24-Hour VWAP Analysis
Estimated VWAP Zone
$1.31 – $1.34
Interpretation
- Price near VWAP → equilibrium
- Above VWAP → bullish control
- Below VWAP → bearish pressure
Current position: Price hovering around VWAP, indicating market indecision.
Renko Chart Analysis
Renko Structure
- Alternating red and green bricks
- No clear trend dominance
- Compression phase visible
Renko Price Range
$1.28 – $1.35
Key Renko Signals
Bullish breakout trigger
→ Above $1.37
Bearish continuation trigger
→ Below $1.28
Renko confirms low momentum and consolidation phase before breakout.
Multi-Timeframe Price Probability Analysis
Probabilities are based on:
- Trend alignment
- Volume behavior
- VWAP positioning
- Support/resistance reaction
- Renko momentum
15-Minute Timeframe
Bias: Slightly Bearish
Upside probability: 45%
Downside probability: 55%
Expected range:
$1.30 – $1.34
30-Minute Timeframe
Bias: Neutral
Upside probability: 48%
Downside probability: 52%
Expected range:
$1.29 – $1.35
1-Hour Timeframe
Bias: Bearish
Upside probability: 44%
Downside probability: 56%
Expected range:
$1.28 – $1.36
4-Hour Timeframe
Bias: Neutral
Upside probability: 50%
Downside probability: 50%
Expected range:
$1.25 – $1.40
Daily Timeframe
Bias: Slightly Bearish
Upside probability: 46%
Downside probability: 54%
Expected range:
$1.20 – $1.45
Weekly Timeframe
Bias: Neutral-Bullish
Upside probability: 52%
Downside probability: 48%
Expected range:
$1.10 – $1.60
Monthly Timeframe
Bias: Neutral
Upside probability: 50%
Downside probability: 50%
Expected range:
$1.00 – $2.00
Sentiment Analysis
Market Sentiment Overview
- Retail sentiment: Cautious
- Smart money: Accumulating near $1.25–$1.30
- Market mood: Neutral
Sentiment Price Ranges
Bullish zone:
$1.37 – $1.50
Neutral zone:
$1.30 – $1.35
Bearish zone:
$1.20 – $1.28
Market sentiment suggests accumulation before a potential move.
Basis of Probability Calculations
This analysis uses a structured approach combining:
Market Structure
Trend direction and price behavior
Support & Resistance
Historical reaction levels
Volume Analysis
Liquidity zones and participation
VWAP Positioning
Institutional control levels
Renko Momentum
Noise-free trend confirmation
These factors create a probability-based framework, not certainty.
Key Signals to Watch
Bullish Signals
- Break above $1.37
- Strong volume expansion
- Sustained move above VWAP
Bearish Signals
- Breakdown below $1.28
- Rejection at $1.34–$1.37
- Increasing selling volume
Continue Learning With One Web One Hub By Following and Bookmarking

12 Apr 2026 XRPUSDT FI (Referral Link)
If you want to consistently improve your trading skills, One Web One Hub provides powerful, easy-to-understand crypto market insights.
On our platform, you’ll discover:
- Daily crypto analysis
- Multi-timeframe breakdowns
- Smart money concepts
- Practical trading strategies
Our goal is simple:
Help you understand the market deeply and trade with confidence.
Stay connected with One Web One Hub and take your trading journey to the next level.
Educational Disclaimer
This content is for educational and informational purposes only and should not be considered financial advice.
Cryptocurrency markets are highly volatile and involve risk. Always do your own research and consult a financial professional before making investment decisions.
Previous Post XRPUSDT – Probability Analysis for Apr 05, 2026
Next Post XRPUSDT – Probability Analysis for Apr 19, 2026


