
BITCOINUSDT – Probability Analysis for February 06, 2026
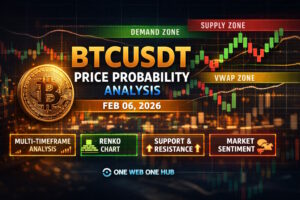
BTCUSDT Price Probability Analysis – Feb 06, 2026
Multi-Timeframe Forecast, VWAP, Renko, Demand-Supply & Market Sentiment
One Web One Hub – Educational Crypto Market Insights
Live Market Context (BTCUSDT)
Bitcoin (BTCUSDT) is currently trading in a highly volatile recovery phase after a sharp weekly drawdown. BTC has recently swept major liquidity below key psychological levels and is now attempting to stabilize in the mid-$60,000 region.
Recent market behavior reflects:
Sharp sell-off followed by aggressive bounce
High liquidation volume across futures markets
ETF-related flows impacting short-term sentiment
Increased intraday volatility and wider trading ranges
This environment creates strong opportunities for volatility-based strategies but also increases overall market risk.
Key Market Structure Overview
BTC is currently transitioning between distribution and corrective accumulation phases.
Current Trading Range
Approximate Range: $60,000 – $72,000
Short-Term Bias: Neutral to Bearish
Medium-Term Bias: Bearish corrective phase
Macro Bias: Volatile consolidation
Market structure shows lower highs forming, while demand zones are being defended aggressively.
Demand & Supply Zones
Major Demand Zones
Primary Demand Zone
$59,500 – $61,500
This zone represents major historical buying interest and was the recent liquidity sweep area that triggered a strong bounce.
Secondary Demand Zone
$63,000 – $64,200
This is a short-term intraday reaction zone where buyers are currently stepping in on dips.
Major Supply Zones
Primary Supply Zone
$70,500 – $72,000
This zone has acted as strong resistance with repeated rejections.
Secondary Supply Zone
$74,500 – $76,000
Previous support turned resistance. Heavy sell pressure is expected in this region.
Support & Resistance Levels
Key Support Levels
$60,000 – Psychological and liquidity low
$63,200 – Short-term structural support
$65,000 – Intraday balance and reaction level
Key Resistance Levels
$68,500 – Immediate intraday resistance
$70,800 – Supply zone midpoint
$74,000 – Higher timeframe resistance
24H VWAP Zone Analysis
Based on intraday price behavior and volatility structure:
Estimated 24H VWAP Zone
$65,200 – $66,500
How to Interpret the VWAP Zone
Price holding above VWAP zone suggests short-term bullish reaction potential.
Price rejection below VWAP zone suggests bearish continuation risk.
Multiple VWAP tests usually indicate range-bound and indecisive conditions.
BTC is currently rotating near this VWAP equilibrium area, signaling short-term indecision and two-sided liquidity.
Renko Chart Analysis
Renko chart structure highlights trend strength and momentum without time-based noise.
Recent Renko behavior shows:
Brick reversals after aggressive downside
Lower highs forming on Renko structure
Trend compression indicating possible volatility expansion
Renko Trend Bias
Short-term: Sideways to bearish
Medium-term: Bearish corrective phase
Bullish confirmation only on sustained Renko continuation above $72,000
Multi-Timeframe Price Probability Analysis
15 Minute BTCUSDT Probability Outlook
Bias: Range-bound volatility
55% probability of chop between $64,800 – $67,200
30% probability of bearish sweep toward $63,800
15% probability of bullish spike toward $68,500
30 Minute BTCUSDT Probability Outlook
Bias: Bearish to neutral
50% probability of VWAP zone retest
35% probability of breakdown toward $63,500
15% probability of recovery toward $69,000
1 Hour BTCUSDT Probability Outlook
Bias: Bearish corrective
45% probability of lower high formation
40% probability of sideways consolidation
15% probability of short squeeze above $70,000
4 Hour BTCUSDT Probability Outlook
Bias: Bearish structure intact
50% probability of demand zone retest near $63,000
30% probability of continued range
20% probability of bullish breakout toward $72,000
Daily BTCUSDT Probability Outlook
Bias: Corrective bearish
55% probability of consolidation below $72,000
30% probability of breakdown toward $58,000 – $60,000
15% probability of bullish reclaim above $74,000
Weekly BTCUSDT Probability Outlook
Bias: Bearish retracement phase
60% probability of deeper corrective structure
25% probability of base building near demand
15% probability of bullish trend resumption
Monthly BTCUSDT Probability Outlook
Bias: Macro volatile consolidation
50% probability of large range continuation
30% probability of extended correction
20% probability of bullish macro reversal
Market Sentiment Analysis
Overall market sentiment is currently bearish to fearful.
Key sentiment drivers include:
Large liquidation clusters
ETF-related outflows
Negative funding earlier in the week
Risk-off macro environment
Heightened trader uncertainty
Extreme fear environments often support short-term bounces but also increase volatility risk.
Basis of Probability Methodology
The probability estimates in this analysis are derived from:
Multi-timeframe structure alignment
Liquidity sweep behavior
Historical reaction zones
VWAP equilibrium behavior
Renko trend structure
Volatility expansion patterns
Market sentiment and funding context
These probabilities are educational estimates based on statistical market behavior — not guarantees.
Educational Trading Context
Current BTCUSDT conditions favor:
Short-term scalping strategies
VWAP-based mean reversion setups
Range trading near demand and supply
Reduced position sizing due to volatility
Trend-following strategies carry higher risk until higher timeframe structure confirms.
Important Educational Disclaimer
This content is for educational and informational purposes only.
This is not financial advice, investment advice, or trading advice.
Cryptocurrency markets are highly volatile and involve significant risk.
Always conduct your own research and consult a licensed financial advisor before making any financial decisions.
Please Follow & Bookmark One Web One Hub
06 Feb 2026 BTCUSDT
One Web One Hub is your trusted platform for structured, educational crypto market insights. Our goal is to help traders and learners understand real market behavior — not just signals.
Why Follow One Web One Hub for Market Education
Daily educational market breakdowns
Multi-timeframe probability analysis
VWAP, liquidity & structure concepts
Beginner-friendly to advanced trader education
Consistent updates for Bitcoin and altcoins
If you found this BTCUSDT analysis useful, explore more in-depth educational content on One Web One Hub and bookmark the blog for daily market structure insights.
Stay connected, stay educated, and trade smarter with One Web One Hub.
Previous Post BITCOINUSDT – Probability Analysis for November 17, 2025
Next Post BITCOINUSDT – Probability Analysis for February 11, 2026


