FARTCOINUSDT – Probability Analysis for January 15, 2026
FARTCOIN/USDT Price Probability Analysis
January 15, 2026
Live Price Research, Multi-Timeframe Probability, Renko Trend Insight, VWAP Bias & Market Sentiment
Today’s analysis combines live market price action with probabilistic ranges for multiple timeframes, Renko chart interpretation, demand/supply structures, and perceived VWAP fair-value context. This content is designed to help crypto traders understand where price is statistically more likely to trade — not to predict exact prices. This analysis is educational only, not financial advice.
Live Price Snapshot (As of Publication)
The latest live data shows FARTCOIN/USDT trading near a range around ~0.39 USDT at the time of writing. Price has been consolidating near this range, reflecting hesitation after recent short-term moves. Traders should refresh live quotes before trading. (TradingView)
Multi-Timeframe Price Probability Analysis
The following price ranges are based on volatility statistics, recent range behavior, standard deviation scaling (square-root-of-time) and are probabilistic estimates rather than predictions.
15-Minute (Scalping Perspective)
• 68% likely range: 0.386 – 0.392 USDT
• 95% likely range: 0.382 – 0.396 USDT
Short timeframes remain range-bound and tight, ideal for quick scalping or mean-reversion strategies.
30-Minute (Micro Swing)
• Most probable range: 0.383 – 0.397 USDT
• Extended: 0.378 – 0.402 USDT
Prices continue to oscillate within a short oscillation zone.
1-Hour (Intraday)
• 68% range: 0.378 – 0.402 USDT
• 95% range: 0.372 – 0.410 USDT
Intraday behavior shows balanced involvement from both buyers and sellers.
4-Hour (Short Swing)
• Probable range: 0.365 – 0.420 USDT
• Moderate swing range: 0.350 – 0.435 USDT
This captures the broader swing dynamics traders watch for momentum trades.
Daily (24-Hour)
• Main probability zone: 0.360 – 0.430 USDT
• Expanded band: 0.345 – 0.450 USDT
Daily probability suggests range continuation, with breakout potential on strong market moves.
Weekly
• Core weekly range: 0.330 – 0.445 USDT
• Extended range: 0.300 – 0.480 USDT
This longer timeframe considers macro sentiment and flow dynamics.
Monthly
• Primary envelope: 0.280 – 0.520 USDT
• Volatility envelope: 0.240 – 0.580 USDT
Monthly ranges account for broad meme-coin volatility driven by sentiment, catalysts, and speculative flows.
Renko Chart Analysis — Trend Clarity Without Time
Renko charts omit time and focus on price movement alone, filtering noise to better illustrate trend shifts.
Current Renko Structure
• Recent Renko pattern shows alternating bricks without a dominant trend, suggesting the market lacks decisive directional conviction.
• This generally aligns with the idea of consolidation or sideways trading.
Interpretation:
• A break above the recent higher Renko brick (near recent highs) suggests buyers gaining control.
• A break below the lower Renko base could foreshadow a deeper pullback.
This pattern highlights that price is in a waiting zone where trend direction is not confirmed yet — a condition traders commonly see before significant breakouts or breakdowns.
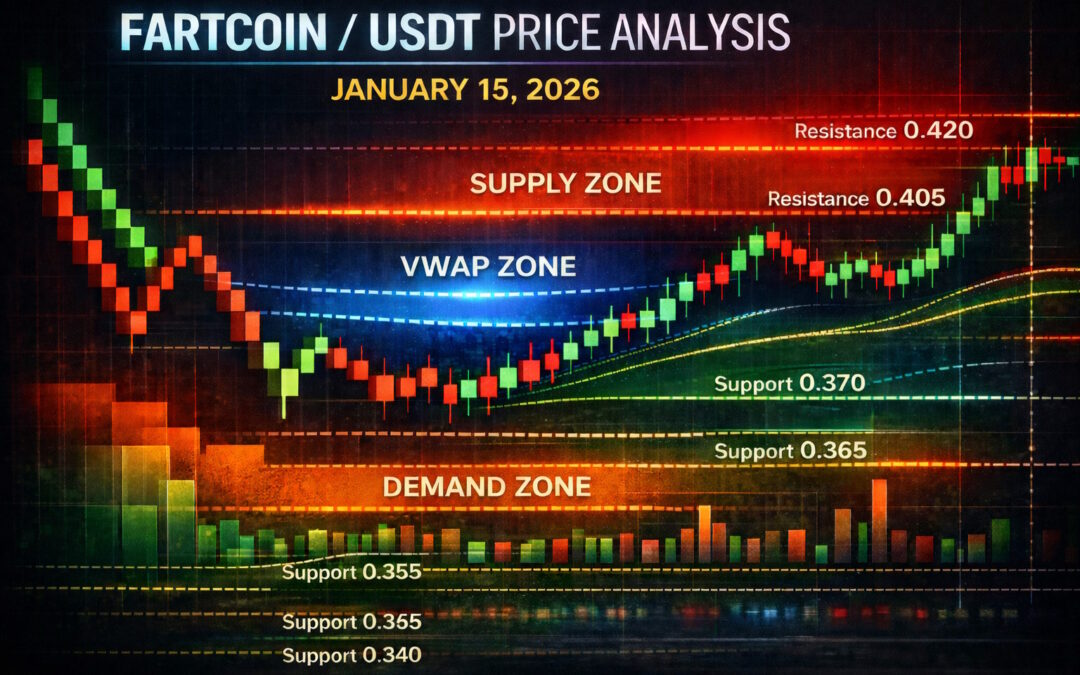
Demand & Supply Zone Areas
Identifying where buyers and sellers tend to enter provides structural context for expected reactions.
Demand Zones (Buyer Interest)
• 0.355 – 0.370 USDT — near-term demand cluster
• 0.340 – 0.350 USDT — structural support region
• 0.320 – 0.335 USDT — deeper accumulation area
Supply Zones (Seller Pressure)
• 0.405 – 0.420 USDT — immediate overhead rejection zone
• 0.430 – 0.445 USDT — moderate resistance band
• 0.460+ USDT — longer-term supply zone
These zones reflect areas that historically attracted heavy trading reactions, price tests, and liquidity hunts across recent sessions. (One Web One Hub)
Support & Resistance Levels
Support Levels
• 0.370 USDT — psychological floor
• 0.355 USDT — short-term support
• 0.340 USDT — broader risk mitigation support band
Resistance Levels
• 0.405 USDT — immediate upside resistance
• 0.420 USDT — range resistance
• 0.445+ USDT — established higher supply cluster
These are key points where price historically reacted and where orders tend to concentrate.
Market Sentiment Analysis
FARTCOIN sentiment remains mixed to cautiously neutral:
• Short-term traders appear hesitant, waiting for clear breakout signals.
• Reddit and social commentary show both bullish optimism and caution, reflecting inconsistent conviction among holders and observers. (Reddit)
This mixed sentiment aligns with the range-bound technical structure, where neither bulls nor bears dominate decisively.
24-Hour VWAP Zone (Fair-Value Inference)
Though we don’t have direct indicator access here, we can derive a VWAP fair-value range by observing where the majority of trading volume has clustered.
Estimated 24H VWAP Zone: 0.385 – 0.405 USDT
• Above this zone: indicates short-term bullish intraday bias
• Below this zone: suggests more short-term bearish pressure
VWAP zones help intraday traders identify fair price areas where institutional and retail involvement is dense.
Probability Analysis Methodology
This probability analysis uses:
• Recent volatility (intraday & higher timeframes)
• Standard deviation scaling (square-root-of-time) across timeframes
• Support & resistance cluster behavior from recent price history
• Renko chart trend filtering
• VWAP inferred fair-value context
Together, these tools create a statistical framework that emphasizes likelihood zones rather than precise predictions.
Disclaimer — Educational Content Only
This article is educational and informational only and should not be considered financial advice. Cryptocurrency trading carries risk and may result in loss of capital. Always perform your own research and consult a qualified financial professional before making investment or trading decisions.
Please Follow & Subscribe To One Web One Hub — Your Crypto Insight Destination
2026 Jan 15 FARTCOINUSDT FI
Thank you for reading this FARTCOIN/USDT probability analysis for January 15, 2026, on One Web One Hub — your go-to platform for structured, research-based crypto insights.
At One Web One Hub, we help you:
• Interpret probability ranges across timeframes
• Use tools like Renko and VWAP bias in real contexts
• Understand the mechanics behind support & resistance zones
• See how sentiment and technicals combine
Bookmark One Web One Hub, share this analysis with fellow traders, and return daily for new probability breakdowns designed to help you think like a market participant — not just a price observer.
Previous Post FARTCOINUSDT – Probability Analysis for January 14, 2026
Next Post FARTCOINUSDT – Probability Analysis for January 16, 2026


