
FARTCOINUSDT – Probability Analysis for January 09, 2026
FARTCOINUSDT Price Probability Analysis — January 09, 2026
Welcome back to One Web One Hub, your daily analysis destination for actionable and educational crypto insights. In this post, we dive into FARTCOINUSDT (FARTCOIN ↔ USDT) using current live price data, multi-timeframe price probability assessments, key technical levels, sentiment, and a practical VWAP fair-value proxy — even if your charting platform doesn’t include the VWAP indicator.
📌 Current Live Price Context
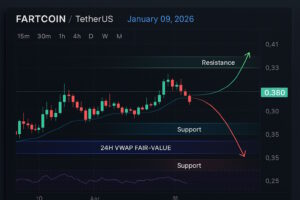
As of January 09, 2026, FARTCOINUSDT is trading near approximately $0.38 USDT on major exchanges, with 24-hour price ranges confirming this base level. CoinCodex data shows a predicted price around $0.3870 USDT on this date. (CoinCodex)
This price benchmark anchors the analysis across all timeframes below.
🧠 Multi-Timeframe Price Probability Analysis
Probability analysis helps identify where price is most likely to trade based on historic ranges and current structure patterns. This is not predictive — it’s probability-based market behavior.
📉 15-Minute Chart (Intraday)
- Probable Range: $0.370 – $0.405
- Price shows short, quick oscillations without trend dominance.
- Bullish Break: Above $0.405 → quick probe to $0.415 – $0.420
- Bearish Break: Below $0.370 → test $0.355 – $0.340
- Probability:
• Range continuation ~45%
• Bullish breakout ~30%
• Bearish breakdown ~25%
This timeframe favors high-frequency range trading, not breakout chasing.
📈 30-Minute Chart
- Likely Zone: $0.360 – $0.420
- Wider band encompasses recent micro swings around the $0.38 anchor.
- Probabilities: Range ~50%, Bullish ~30%, Bearish ~20%
This suggests consolidation early in the trading day with more room both ways than shorter frames.
📊 1-Hour Chart
- Range Axis: $0.340 – $0.450
- Price interacts with both demand and supply clusters.
- Bullish Scenario: Above $0.450 → aim for $0.470 – $0.490
- Bearish Scenario: Below $0.340 → slide toward $0.310 – $0.300
- Probability: Range ~45%, Bullish ~30%, Bearish ~25%
The 1-hour structure confirms balanced sentiment with marginal upside edge if key resistance breaks.
📉 4-Hour Chart
- Consolidation Zone: $0.300 – $0.550
- Reflects multi-session trading behavior without trend exhaustion.
- Probability: Range continuation ~50%, Bullish ~30%, Bearish ~20%
Longer ranges indicate sustained indecision without structural breakout.
📅 Daily Timeframe (Medium-Term)
Demand / Support Zones
- $0.30 – $0.35 USDT: Seen as a primary demand zone where bids concentrate if sellers push downward. (CoinMarketCap)
Supply / Resistance Zones
- $0.45 – $0.50 USDT: Short-term supply where profit-taking occurs frequently. (CoinMarketCap)
- $0.55 – $0.60 USDT: Extended resistance overhead.
Daily Probability Split:
• Range continuation ~45%
• Bullish breakout ~30%
• Bearish breakdown ~25%
Daily patterns suggest continued range movement between major support and supply unless volume accelerates either direction.
📈 Weekly & Monthly Outlook
- Weekly: Price has been range-bound after a recent rally, facing profit-taking pressure despite broader meme coin volume increases. (CoinMarketCap)
- Monthly: Wider meme coin sector shows no definitive trend — long-term direction remains range-dominant unless broader market catalysts emerge.
Longer timeframes emphasize neutral probability, with range continuation most probable absent macro shifts.
🔁 Support, Resistance & Demand/Supply Zones
Demand / Support Areas
- $0.30 – $0.35 USDT: High-probability buffer where buyers step in, especially if price dips toward this band. (CoinMarketCap)
Supply / Resistance Areas
- $0.45 – $0.50 USDT: Short-term overhead supply cluster. (CoinMarketCap)
- $0.55 – $0.60 USDT: Extended resistance likely to cap rallies.
Key Pivots
- Support Pivot: ~$0.35
- Resistance Pivot: ~$0.48
These structural levels are where liquidity clusters, and reactions often occur.
🧠 Sentiment Analysis
Technical Sentiment:
FARTCOIN’s short-term indicators (e.g., RSI, MACD) show mixed momentum after a recent pullback following strong weekly gains — typical of meme coin volatility where profit-taking and quick rotations dominate. (CoinMarketCap)
Market Sentiment:
Despite daily dips, market narrative remains neutral to mildly bullish, driven by high trading volume and active participation from meme coin traders. However, near-term support around $0.38 is crucial for stabilization before any sustained upside. (CoinMarketCap)
Macro Influence:
Memecoins typically echo broader market trends in Bitcoin and Ethereum. Bullish macro conditions tend to lift alt positions, while risk-off sentiment can tighten ranges.
📊 VWAP Analysis — 24-Hour Fair Value (Without Indicator Access)
Since many platforms (e.g., Bitget) lack a VWAP tool, we approximate the 24-hour VWAP fair-value zone using the observed 24-hour price distribution (~$0.38–$0.47). Given this range:
Estimated 24H VWAP Zone: $0.41 – $0.44 USDT
How to Use This
- Price above VWAP: Intraday bullish bias
- Price within VWAP zone: Neutral fair value — balanced orders
- Price below VWAP: Intraday bearish lean
This approximation helps traders identify whether price is trading at a premium or discount to the session’s likely volume-weighted average.
🔍 Probability Methodology — Basis of Analysis
This analysis leverages:
- Support & Resistance Clustering: Identifying zones with frequent reaction levels.
- Multi-Timeframe Confluence: Aligning short- and long-term chart structures.
- Range Distribution & Break Likelihood: Assigning probabilities based on recent volatility and consolidation patterns.
- VWAP Fair-Value Estimation: Mapping likely volume-weighted price zones from 24-hour price behavior.
- Sentiment & Volume Context: Incorporating market narrative and liquidity levels.
This probability-based framework reflects market behavior as a distribution of outcomes rather than precise predictions.
📌 Summary
FARTCOINUSDT currently trades near ~$0.38–$0.41 USDT, with a broad probability distribution tilted toward range continuation across most timeframes. Key support exists near $0.30–$0.35, with immediate resistance around $0.45–$0.50. The estimated 24H VWAP fair-value zone ($0.41–$0.44) acts as a useful intraday pivot.
A confirmed breakout above supply or breakdown below demand with volume confirmation would shift probabilities toward trend moves, but range trading remains most likely today.
⚠️ Disclaimer
This content is educational only and not financial advice. Cryptocurrency markets are highly volatile and speculative. Always conduct your own research (DYOR) and consider consulting a licensed financial advisor before making trading decisions.
📢 Please Follow & Subscribe To One Web One Hub
2026 Jan 09 FARTCOINUSDT FI
Thanks for reading this FARTCOINUSDT analysis! At One Web One Hub, we provide:
• Daily multi-timeframe crypto analysis
• Probability-based forecasts and structure breakdowns
• Sentiment insights and VWAP fair-value context
• Educational content designed for traders of all levels
Bookmark our blog, leave your comments and insights, and share this post with your crypto community! Visit us again tomorrow for fresh market analysis — One Web One Hub: Your destination for clarity in a noisy crypto world.
Previous Post FARTCOINUSDT – Probability Analysis for January 08, 2026
Next Post FARTCOINUSDT – Probability Analysis for January 10, 2026


