FARTCOINUSDT – Probability Analysis for January 08, 2026
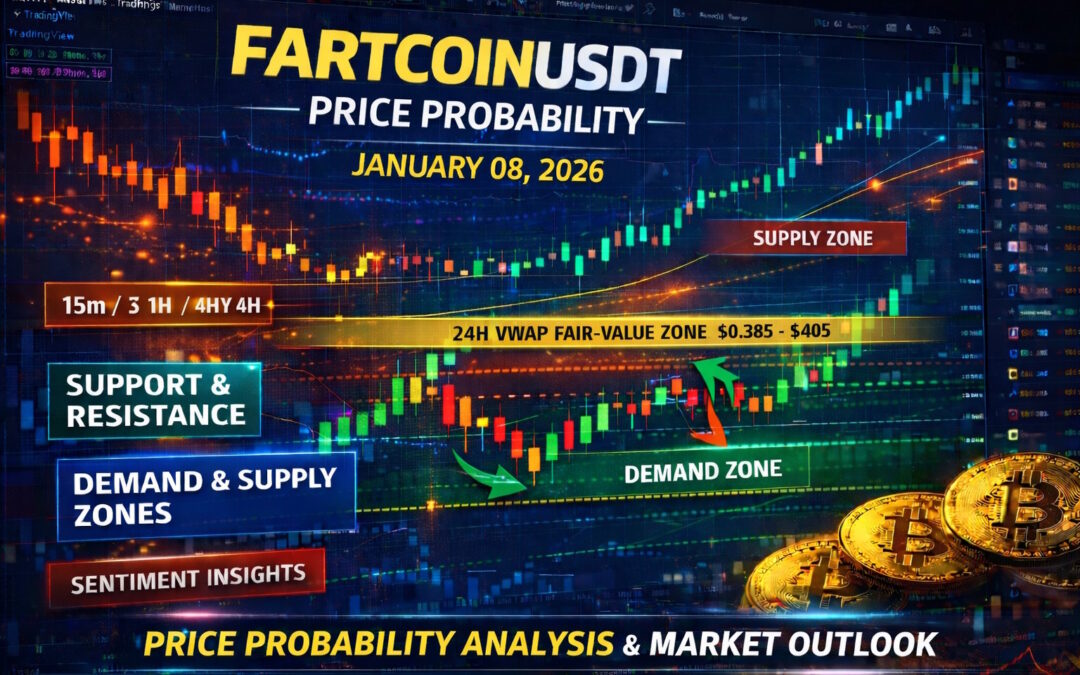
FARTCOINUSDT Price Probability Analysis – January 08, 2026
Multi-Timeframe Outlook | VWAP Mapping | Sentiment & Key Levels
Welcome back to One Web One Hub, where we focus on probabilities, structure, and risk awareness — not hype.
This analysis of FARTCOINUSDT is based on current market structure with price trading around 0.38 USDT, as observed on TradingView and CoinMarketCap at the time of writing.
Rather than predicting a single outcome, this post outlines high-probability price zones across multiple timeframes, helping traders and learners understand where price is statistically more likely to react.
Current Market Context (Reference Point)
- Reference Price: ~0.38 USDT
- Market Type: High-volatility meme asset
- Structure: Post-impulse consolidation below prior supply
- Behavior: Mean-reversion driven with sharp liquidity sweeps
At 0.38, FARTCOIN is trading below mid-range value, indicating price is currently testing a discount zone, not premium.
Multi-Timeframe Price Probability Analysis
15-Minute Timeframe (Scalp / Micro Moves)
- Likely Range: 0.365 – 0.395
- Bias: Range-bound with liquidity grabs
- Upside Probability: ~35% (toward 0.40)
- Downside Probability: ~25% (toward 0.36)
- Range Continuation: ~40%
This timeframe favors mean reversion trades, not trend chasing.
30-Minute Timeframe
- Range Expansion Zone: 0.36 – 0.41
- Key Reaction Area: 0.38–0.39
- Probability Breakdown
- Consolidation: ~45%
- Bullish push: ~30%
- Bearish sweep: ~25%
Price repeatedly rotates around short-term equilibrium.
1-Hour Timeframe
- Primary Structure Range: 0.34 – 0.44
- Key Observation: Buyers defend sub-0.36 aggressively
- Bullish Scenario (~30%)
- Acceptance above 0.40 → test 0.43–0.44
- Bearish Scenario (~25%)
- Loss of 0.35 → drop toward 0.32
- Range Probability: ~45%
4-Hour Timeframe
- Macro Intraday Range: 0.30 – 0.50
- Current Position: Lower-mid range
- Interpretation: Price is cheap, not weak
This timeframe supports range accumulation, not panic selling.
Daily Timeframe Analysis
Demand Zones (High-Probability Buy Interest)
- 0.34 – 0.36 → Strong historical demand
- 0.30 – 0.32 → Extreme discount / panic zone
Supply Zones (Sell Pressure)
- 0.42 – 0.45 → Immediate resistance
- 0.50 – 0.55 → Major distribution zone
At 0.38, price sits above demand but below supply, statistically favoring choppy sideways action.
Weekly & Monthly Perspective
- Weekly: Broad sideways structure, no confirmed trend
- Monthly: Volatility-driven meme cycle behavior
Long-term probability favors range rotation, not straight-line moves.
VWAP Analysis – 24H Fair Value (No Indicator Required)
Since VWAP is unavailable on Bitget, we approximate it using:
- 24H high-low distribution
- Price clustering
- Repeated reaction midpoints
Estimated 24H VWAP Fair-Value Zone:
0.385 – 0.405 USDT
Interpretation
- Below VWAP zone: Discount → bounce-prone
- Inside VWAP: Fair value → chop
- Above VWAP: Premium → rejection risk
👉 At ~0.38, price is slightly below VWAP, suggesting mean-reversion probability > trend continuation.
Sentiment Analysis
Technical Sentiment
- Neutral-to-slightly bullish
- Oversold reactions visible near 0.35–0.36
- Momentum weak but stabilizing
Market Psychology
- Fear after rejection from higher levels
- Dip-buyers active, FOMO absent
- Healthy for range trading, not moon shots
Probability Summary (Next Few Days)
| Scenario | Probability |
|---|---|
| Sideways consolidation | ~45% |
| Bounce toward 0.42–0.44 | ~30% |
| Breakdown toward 0.32 | ~25% |
⚠️ An 80% probability move to 0.33 is NOT supported at the current structure unless 0.35 decisively fails.
How These Probabilities Are Calculated
- Multi-timeframe support & resistance confluence
- Range statistics, not predictions
- VWAP fair-value approximation
- Volatility behavior of meme assets
- Historical reaction zones
This is probability modeling, not price calling.
Disclaimer
This content is strictly for educational purposes only and does not constitute financial advice. Cryptocurrency markets are highly volatile and speculative. Always conduct your own research and manage risk responsibly.
Please Follow & Subscribe To One Web One Hub
2026 Jan 08 FARTCOINUSDT FI
At One Web One Hub, we don’t sell hype — we teach how markets actually behave.
✔ Probability-based crypto analysis
✔ Multi-timeframe clarity
✔ VWAP logic without paid tools
✔ Content designed to improve trader decision-making
If this helped you see the market more clearly, bookmark the site, revisit daily, and share it with other traders who value logic over noise.
Previous Post FARTCOINUSDT – Probability Analysis for January 07, 2026
Next Post FARTCOINUSDT – Probability Analysis for January 09, 2026


