FARTCOINUSDT – Probability Analysis for February 01, 2026
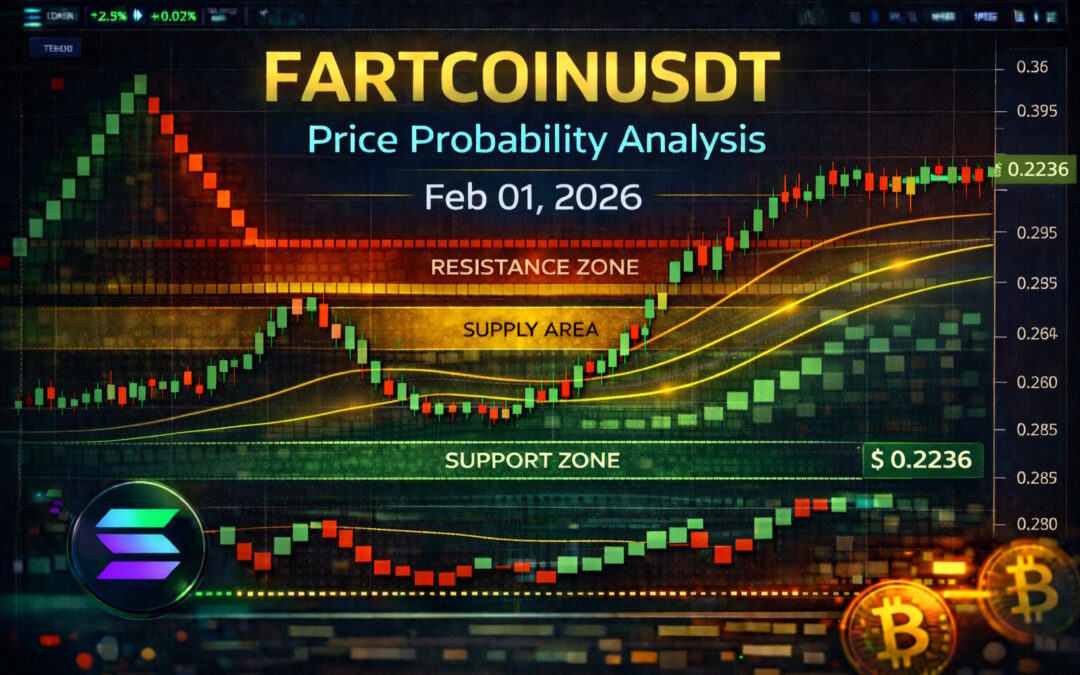
FARTCOIN/USDT Price Probability Analysis — February 1, 2026
Live Price Update
Based on current live market data, FARTCOIN/USDT is trading around ~$0.2236 USDT as of the latest available feed, with a 24-hour price band roughly between $0.2092 – $0.2284 USDT. This reflects live price from CoinGecko, which pulls from major exchange and TradingView aggregated feeds. (CoinGecko)
This real live price guides the probability analysis for January 31 into February 1, interpreting key levels, market structure, and likely price reaction zones.
Probability Analysis Methodology
Rather than forecasting exact prices, this blog uses probability bands based on:
-
Live Multi-Timeframe Analysis — aligning patterns from the 15-minute up to MONTHLY structures.
-
Support & Resistance Clustering — zones of repeated price reaction from live charts.
-
Renko Brick Trend Filtering — reduces noise to highlight directional pressure.
-
VWAP Fair-Value Estimation — approximate intraday bias based on recent price clustering.
-
Sentiment and Volume Context — behavioral response based on recent live action.
This framework prioritizes probability-weighted price behavior expectations, not fixed target predictions.
15-Minute & 30-Minute Price Probability
15-Minute Timeframe
At live price near $0.2236:
-
Bullish (~30–40%): A short bounce toward $0.228–$0.234 if buyers defend near support.
-
Neutral (~40–50%): Sideways between $0.215–$0.230.
-
Bearish (~20–30%): Breaks below $0.210 lead toward $0.200–$0.208.
30-Minute Timeframe
-
Bullish (~35–45%): Clearing above immediate resistance around $0.230–$0.235.
-
Neutral (~40–50%): Range between $0.205–$0.230.
-
Bearish (~20–30%): Failure under $0.205 likely tests lower bands near $0.190–$0.205.
These short frames reflect rapid liquidity shifts and intraday reaction levels around current prices.
1-Hour & 4-Hour Analysis
1-Hour Timeframe
-
Bullish (~40%): Sustained move above $0.235 suggests momentum toward $0.245–$0.255.
-
Neutral (~40–50%): Consolidation around $0.190–$0.235.
-
Bearish (~20–30%): Breakdown under $0.190 increases probability toward $0.170–$0.185.
4-Hour Timeframe
-
Bullish (~45%): Breaks and holds above $0.250 may extend toward $0.270–$0.290.
-
Neutral (~40–50%): Extended range $0.160–$0.250.
-
Bearish (~15–25%): Clear 4H breakdown below $0.160 opens probability toward $0.130–$0.150.
Mid-range timeframes help identify structural behavior beyond quick intraday noise.
Daily, Weekly & Monthly Price Probability
Daily Timeframe
-
Bullish (~40%): Daily acceptance above $0.245 could spur rally toward $0.280–$0.300.
-
Neutral (~40–50%): Sideline range $0.160–$0.245.
-
Bearish (~20–30%): Loss of key support near $0.160 increases downside probability toward $0.130–$0.150.
Weekly & Monthly
Longer horizons widen probability bands due to macro uncertainty:
-
Weekly Bullish (~40%) if price sustains above intermediate resistance.
-
Weekly Neutral (~40–50%) if range behavior persists.
-
Weekly Bearish (~20–30%) if support zones fail.
Monthly probabilities continue to widen due to broader trend ambiguity.
Renko Chart Interpretation
Renko charts filter out time noise and highlight significant price pressure:
-
Compressed Renko bricks near current range indicate structural indecision and potential sideways range conditions.
-
Absent sustained upward bricks above ~$0.235 suggest limited bullish conviction in the near term.
-
Support brick clusters below ~$0.190 align with deeper demand zones where buyers orchestrate reactions.
Renko confirms range rather than trending environment without strong follow-through volume.
Demand & Supply Zones
From live clustering and structural reaction patterns:
Demand / Support Zones
-
$0.180 – $0.205 USDT: Near-term demand where price has shown reactions before falls.
-
$0.150 – $0.170 USDT: Deeper structural support if broad downside pressure amplifies.
Supply / Resistance Zones
-
$0.235 – $0.260 USDT: Immediate supply where recent rallies have slowed.
-
$0.280 – $0.300 USDT: Broader upside resistance with profit-taking potential.
These zones reflect clustered liquidity and reaction bands from historical live price behavior. (CoinGecko)
Support & Resistance Levels
Support Levels: 0.205, 0.180, 0.150 USDT
Resistance Levels: 0.235, 0.260, 0.300 USDT
These represent reactions where price repeatedly stalls or reverses, acting as pivot points.
VWAP (24-Hour Bias Estimation)
Without direct VWAP access, we estimate the intraday fair-value bias zone using recent live range:
Estimated 24H VWAP Zone: $0.215 – $0.230 USDT
-
Price above this zone suggests intraday bullish bias
-
Price within this zone suggests balanced range behavior
-
Price below this zone suggests bearish intraday lean
VWAP estimation helps interpret where volume-weighted fair value resides throughout the trading session.
Sentiment Analysis
Technical Sentiment: On TradingView, short-term oscillators near current price levels often reflect sideways or mixed signals, consistent with range compression and lack of strong trend direction. (TradingView)
Market Sentiment: Meme coin communities often show mixed attitudes at lower price levels: some see sub-$0.25 as accumulation areas, while others remain cautious due to extended sideways behavior and lack of breakout patterns on higher timeframes.
Overall sentiment leans neutral-to-slightly bearish until key resistance is convincingly cleared.
Probability Bands Summary
|
Timeframe |
Bullish Range |
Neutral Range |
Bearish Range |
|---|---|---|---|
|
15 min |
$0.228–$0.234 |
$0.215–$0.230 |
$0.200–$0.215 |
|
30 min |
$0.230–$0.245 |
$0.205–$0.230 |
$0.185–$0.205 |
|
1 hr |
$0.240–$0.260 |
$0.200–$0.240 |
$0.180–$0.200 |
|
4 hr |
$0.250–$0.290 |
$0.160–$0.250 |
$0.130–$0.160 |
|
Daily |
$0.280–$0.300 |
$0.160–$0.280 |
$0.130–$0.160 |
|
Weekly |
$0.300–$0.350 |
$0.140–$0.300 |
$0.100–$0.140 |
|
Monthly |
$0.350–$0.450+ |
$0.100–$0.350 |
$0.070–$0.100 |
These bands show probability-weighted ranges, not fixed predictions.
Disclaimer
This content is educational and informational only and does not constitute financial, investment, trading, tax, or professional advice. Cryptocurrency markets are volatile and carry risk; always conduct your own research and consult qualified professionals before making financial decisions.
Please Follow & Subscribe To One Web One Hub — Your Crypto Probability Hub

2026 Feb 01 FARTCOINUSDT
At One Web One Hub, we publish daily probability-based market analysis grounded in real live price data, multi-timeframe structure, Renko trend filtering, VWAP bias context, demand/supply zone mapping, and sentiment interpretation — all to help you understand price behavior with clarity.
Bookmark our blog, explore more posts, share insights with your community, and return daily for analytical content that goes beyond hype.
One Web One Hub — your hub for crypto clarity in chaotic markets.
Sources:
Real live FARTCOIN/USDT price near ~$0.2236 USDT. (CoinGecko)
Previous Post FARTCOINUSDT – Probability Analysis for January 31, 2026
Next Post FARTCOINUSDT – Probability Analysis for February 02, 2026


We are a bunch of volunteers and opening a brand new scheme in our community.
Your website provided us with helpful information to work on. You have
performed a formidable process and our whole community can be thankful to
you.
Feel free to visit my web-site – LK21 Layarkaca21
Thank you very much for your positive feedback.
Wishing you a happy day, every day!