FARTCOINUSDT – Probability Analysis for October 16, 2025
FARTCOIN/USDT Probability Analysis – October 16, 2025
The crypto market continues to display high volatility following the recent crash earlier this month. FARTCOIN (FART/USDT), in particular, remains under pressure, though subtle signs of stabilization are emerging within intraday charts.
Daily Overview (October 16, 2025)
As of the latest data, FARTCOIN is trading around $0.38, reflecting a 4% recovery from yesterday’s low near $0.36. The trading volume has declined slightly compared to the first half of October, indicating a phase of consolidation rather than capitulation. RSI has rebounded from oversold territory (30) to around 42, suggesting weakening bearish momentum.
Technical Indicators:
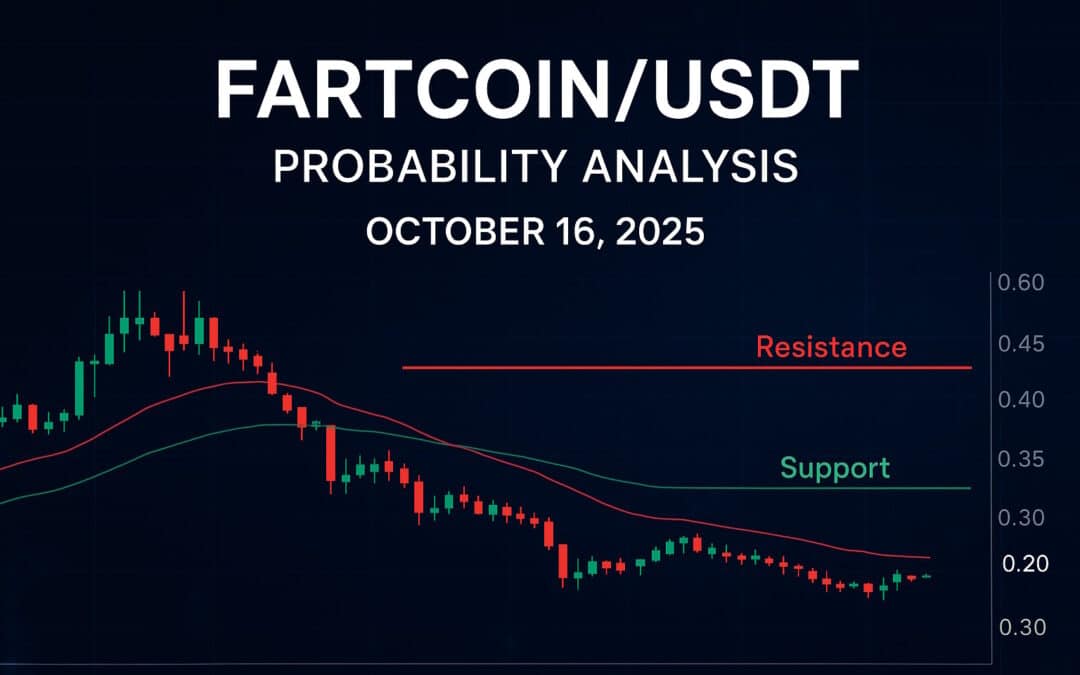
- Support Levels: $0.35 and $0.32
- Resistance Levels: $0.41 and $0.44
- Moving Averages: The 20-day EMA is flattening near $0.40, while the 50-day EMA sits higher at $0.46, maintaining a short-term bearish bias.
Probability Forecasts
Daily Probability:
There’s a 60% probability that FARTCOIN remains range-bound between $0.35 and $0.42 in the next 24 hours. A daily close above $0.42 could confirm the beginning of a short-term rebound phase.
Weekly Probability:
For the week, FARTCOIN shows a 55% probability of attempting recovery toward $0.45 if broader crypto sentiment improves, particularly Bitcoin’s stability above $58,000. Failure to hold $0.35 could reintroduce a slide to $0.30.
Monthly Probability:
The monthly outlook is cautiously optimistic, with a 52% probability that the coin will stabilize and retest $0.50 before the end of October. Accumulation signals are being detected in on-chain data, hinting that long-term holders are reentering after the crash.
Forecast for October 17, 2025:
The next 24 hours will be critical. If volume strengthens above $5 million on Bitget or CoinMarketCap data, a bullish push toward $0.42–$0.43 becomes probable. However, if FARTCOIN drops below $0.35 again, the downside risk could expand toward $0.30.
Conclusion:
FARTCOINUSDT Oct 16 2025 FI
FARTCOIN’s current trend suggests a pause in the downtrend with early indications of stabilization. Conservative traders may wait for a confirmed close above $0.42 before entering, while DCA investors can consider gradual accumulation between $0.33–$0.37 to hedge against volatility.
Disclaimer:
The content on this website is for educational purposes only and not to be taken as financial advice. Please do your own research.


