FARTCOINUSDT – Probability Analysis for November 24, 2025
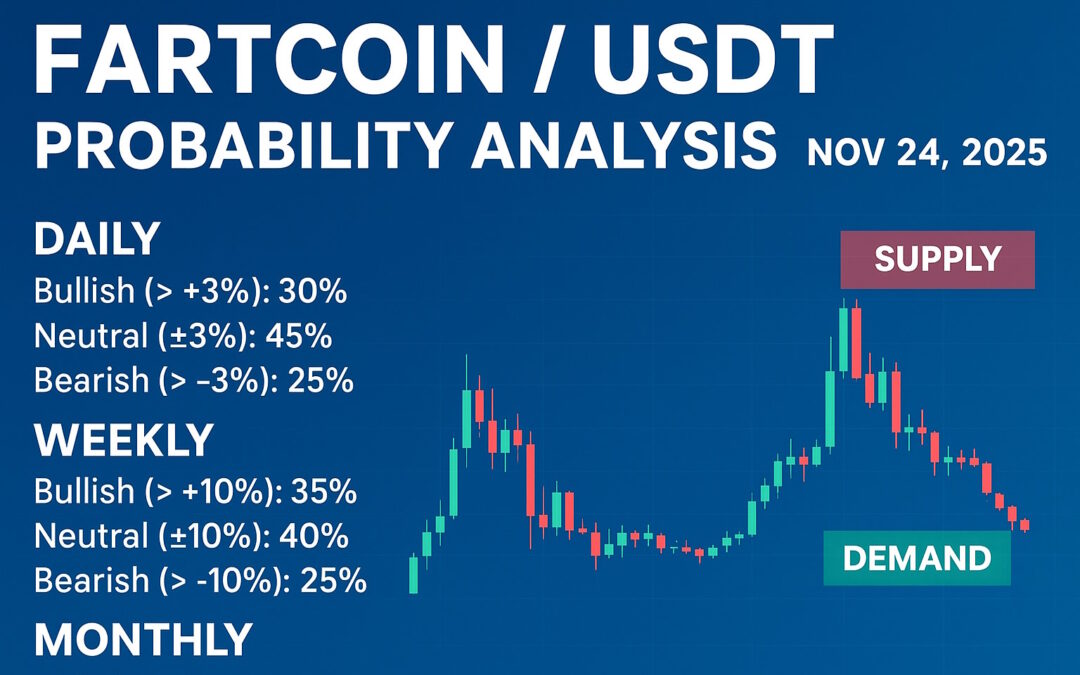
FARTCOIN/USDT — Probability Analysis (Nov 24, 2025)
Live snapshot (check live before trading)
-
Current price ~ $0.248 USDT. (TradingView)
-
24-hour trading volume: roughly $120M–$130M (high liquidity across CEXes). (CoinMarketCap)
-
TradingView technicals (short/medium timeframes): Neutral consensus on moving averages & oscillators at the time of this analysis. (TradingView)
Probability scenarios (reproducible thresholds)
I use reproducible thresholds chosen for a high-volatility memecoin: Daily ±3%, Weekly ±10%, Monthly ±25%. Change thresholds if you prefer tighter/wider buckets.
Daily (24-hour)
-
Bullish (> +3%): 30%
-
Neutral (±3%): 45%
-
Bearish (> −3%): 25%
Why (daily): price sits inside the recent intraday band with neutral TradingView signals; high volume keeps both directions possible, so rangebound/neutral has the largest single probability while a rebound or quick rejection remain plausible. (TradingView)
Weekly (7-day)
-
Bullish (> +10%): 35%
-
Neutral (±10%): 40%
-
Bearish (> −10%): 25%
Why (weekly): seven days allows catalysts (listings, social momentum, futures flows) to push a directional move. Active volume and perp/futures availability increase chances of a clear leg, but absent a breakout the neutral bucket stays largest. (CoinMarketCap)
Monthly (30-day)
-
Bullish (≥ +25%): 40%
-
Neutral (±25%): 35%
-
Bearish (> −25%): 25%
Why (monthly): meme tokens frequently make large monthly moves when social/listing catalysts or leveraged squeezes occur. Given current liquidity and market structure, the bullish tail is the largest on the month horizon while downside risk remains meaningful. (CoinGecko)
Demand & supply zones (multi-timeframe)
Zones are ranges (draw them as rectangles on charts). Confirm with your chart + volume profile.
-
Major (Monthly) Demand Zone: $0.16 – $0.20 USDT — long-term accumulation band (strong buyer interest if revisited). (CoinMarketCap)
-
Weekly Demand Zone: $0.21 – $0.24 USDT — recent consolidation / reaction area (current price near this zone). (TradingView)
-
Daily Demand (short): $0.18 – $0.205 USDT — intraday support and low-wick area. (Yahoo Finance)
-
Daily Supply (short): $0.29 – $0.32 USDT — intraday resistance and recent rejections. (CoinMarketCap)
-
Weekly Supply Zone: $0.29 – $0.33 USDT — local weekly highs with seller congestion. (CoinMarketCap)
-
Major (Monthly) Supply Zone: $0.32 – $0.36 USDT+ — longer-term seller region from prior multi-week peaks. (CoinMarketCap)
Support & Resistance (quick reference)
-
Immediate support: $0.21–$0.22 USDT (weekly/daily demand overlap). (TradingView)
-
Near resistance: $0.29–$0.32 USDT (daily/weekly supply). (CoinMarketCap)
-
Key monthly resistance: $0.32–$0.36 USDT (major supply). (CoinMarketCap)
Practical triggers
-
Bullish signal: decisive daily close above $0.32 on expanding volume → raise weekly/monthly bullish probability. (CoinMarketCap)
-
Bearish signal: decisive daily close below $0.18–$0.20 with heavy selling → shift weekly/monthly toward bearish. (Yahoo Finance)
Methodology — transparent & reproducible
-
Pull live inputs: spot price, 24h high/low, and 24h volume from TradingView / CoinMarketCap / CoinGecko. (TradingView)
-
Read TradingView technicals for baseline sentiment (Neutral / Buy / Sell). (TradingView)
-
Use scenario thresholds (daily ±3%, weekly ±10%, monthly ±25%).
-
Identify supply/demand zones visually from consolidation bases and prior swing-high clusters; confirm with volume on the original impulse move. (CoinMarketCap)
-
Start with a neutral baseline probability (e.g., 45/30/25) then adjust by: price position relative to zones, volume strength, technical consensus, and presence of leveraged markets (which amplify moves).
-
Recompute when a major event (listing, viral mention, large whale flow) or a decisive breakout/breakdown occurs.
Risk & trade-management notes
-
FARTCOIN is a high-volatility memecoin — size positions appropriately and use strict stop limits.
-
Perpetual/futures markets amplify risk via liquidations; avoid excessive leverage unless you fully understand funding and margin mechanics. (TradingView)
-
Re-run this probability model after any major exchange or on-chain event — inputs change rapidly.
Disclaimer (must read)
This post is for educational and informational purposes only and does not constitute financial, investment, or trading advice. Do not interpret this analysis as a recommendation to buy, sell, or hold any asset. Always do your own research, assess your personal risk tolerance, and consult a licensed financial advisor before making investment decisions.
Engage with One Web One Hub
FARTCOINUSDT Nov 24 2025 FI
At One Web One Hub we deliver daily, reproducible market frameworks — probability models, clear supply/demand mapping and risk-first trade guidance so you can make decisions with discipline rather than emotion. Bookmark our posts, subscribe for daily updates, share the analysis with your community, and use our featured images to increase clicks and engagement.


