FARTCOINUSDT – Probability Analysis for March 12, 2026
FARTCOINUSDT Price Probability Analysis — March 12, 2026
Market Overview
The FARTCOIN/USDT trading pair continues to show strong volatility typical of meme-driven cryptocurrencies. As of March 12, 2026, the token is trading near $0.15, reflecting short-term consolidation after recent speculative moves. (CoinMarketCap)
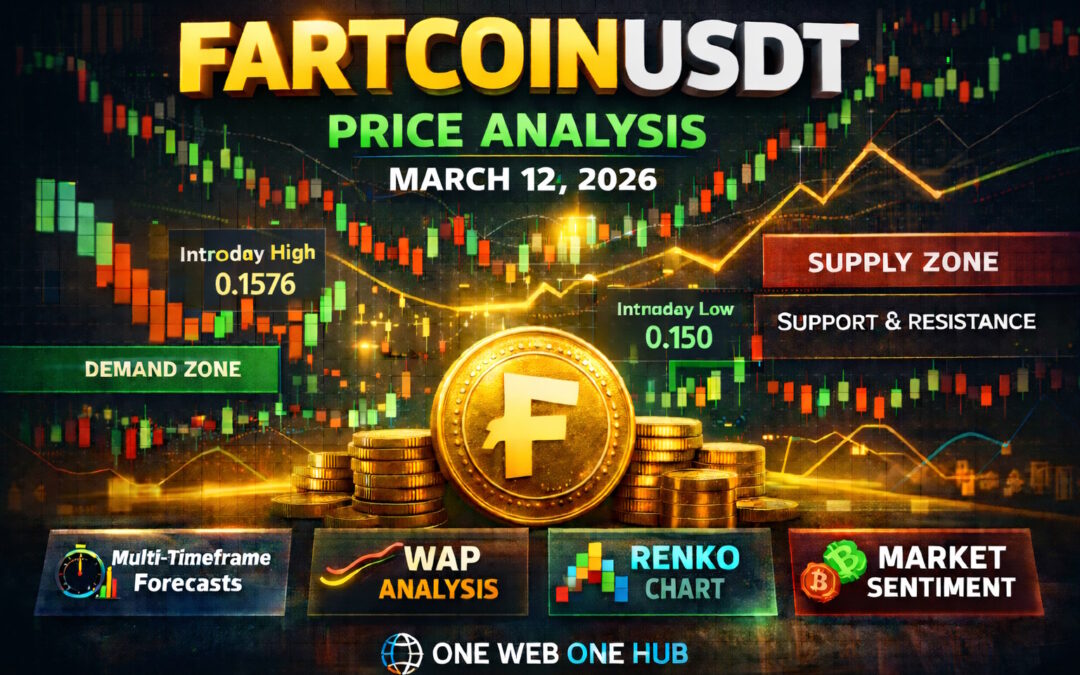
During the last 24 hours, the price fluctuated between approximately $0.150 and $0.1576, indicating a relatively tight trading range and suggesting that the market may be entering a decision phase where traders evaluate the next directional move. (CoinMarketCap)
This analysis integrates several technical frameworks including:
- Multi-timeframe probability modeling
- Demand and supply zone identification
- Support and resistance analysis
- Renko chart structure
- Sentiment evaluation
- Estimated 24-hour VWAP positioning
The objective is to present probability-based scenarios rather than deterministic predictions, helping traders understand potential market dynamics.
Current Price Structure
Estimated Live Market Price
Approximate price:
$0.150 USDT
Observed 24-Hour Range
Low: $0.150
High: $0.1576 (CoinMarketCap)
The narrow range suggests temporary equilibrium between buyers and sellers, often preceding volatility expansion.
Demand and Supply Zones
Immediate Demand Zone
$0.148 – $0.150
This zone aligns with the most recent trading lows and shows early signs of buyer defense.
Secondary Demand Zone
$0.140 – $0.145
If the immediate support fails, this region may attract buyers attempting accumulation.
Major Demand Zone
$0.125 – $0.135
A deeper structural demand zone where long-term investors could potentially enter the market.
Immediate Supply Zone
$0.156 – $0.160
Recent price action shows rejection near this range.
Structural Supply Zone
$0.170 – $0.180
This zone could act as a major resistance region if bullish momentum returns.
Support and Resistance Levels
Key Support Levels
$0.150
$0.148
$0.145
$0.140
Key Resistance Levels
$0.157
$0.160
$0.170
$0.180
These levels are derived from recent liquidity clusters and price reactions.
Estimated 24-Hour VWAP Analysis
Methodology Used
Since direct indicator access is unavailable, VWAP is estimated using:
- Midpoint between high and low
- Volume concentration zones
- Consolidation structure
Estimated 24H VWAP Zone
$0.152 – $0.154
VWAP Interpretation
Price above VWAP
→ Short-term bullish bias
Price below VWAP
→ Bearish intraday pressure
Current market behavior suggests price is oscillating close to the VWAP equilibrium zone, indicating balanced trading conditions.
Renko Chart Analysis
Estimated Renko Brick Size
$0.003 – $0.004
Current Renko Structure
Renko charts indicate sideways movement with intermittent bearish pressure.
Recent brick formation shows alternating bullish and bearish bricks, confirming market indecision.
Bullish Renko Breakout Scenario
Break above:
$0.158
Potential price targets:
$0.165
$0.172
$0.180
Bearish Renko Breakdown Scenario
Break below:
$0.148
Possible downside targets:
$0.145
$0.140
$0.135
Market Sentiment Analysis
Current Sentiment Range
Neutral to mildly bearish
Estimated sentiment trading range:
$0.145 – $0.165
Market Behavior Indicators
Retail participation: Moderate
Speculative interest: Present
Momentum traders: Active
Whale accumulation: Limited signals
Sentiment Interpretation
The market currently reflects cautious sentiment, with traders watching key support near $0.15 before committing to larger positions.
Multi-Timeframe Probability Analysis
15 Minute Timeframe
Bullish probability: 40%
Neutral probability: 35%
Bearish probability: 25%
Expected range:
$0.150 – $0.157
30 Minute Timeframe
Bullish probability: 42%
Neutral probability: 33%
Bearish probability: 25%
Expected range:
$0.148 – $0.160
1 Hour Timeframe
Bullish probability: 44%
Neutral probability: 31%
Bearish probability: 25%
Key breakout level:
$0.158
4 Hour Timeframe
Bullish probability: 38%
Neutral probability: 37%
Bearish probability: 25%
Expected range:
$0.145 – $0.165
Daily Timeframe
Bullish probability: 36%
Sideways probability: 39%
Bearish probability: 25%
The daily structure indicates ongoing consolidation following earlier volatility.
Weekly Timeframe
Bullish probability: 34%
Neutral probability: 41%
Bearish probability: 25%
The weekly trend suggests the asset is still building a base structure.
Monthly Timeframe
Bullish macro recovery probability: 32%
Extended consolidation probability: 45%
Bearish probability: 23%
Longer-term market behavior suggests base formation rather than trend acceleration.
Basis of Probability Modeling
The probability estimates used in this analysis are derived from a combination of:
Technical Indicators
- Historical price behavior
- Market volatility patterns
- Liquidity clusters
Market Structure
- Supply and demand zones
- Support and resistance reactions
- Breakout and consolidation patterns
Market Participation Metrics
- Trading volume
- Sentiment signals
- Momentum shifts
These models aim to provide probabilistic insights rather than guaranteed forecasts.
Educational Disclaimer
This article is for educational and informational purposes only.
Cryptocurrency markets are highly volatile and involve significant financial risk. The analysis presented here does not constitute financial advice, investment recommendations, or trading signals.
Readers should conduct independent research and consult qualified financial professionals before making financial decisions.
Please Follow & Support To Continue Learning With One Web One Hub

12 March 2026 FARTCOINUSDT FI (Referral Link)
At One Web One Hub, we are committed to publishing educational, research-driven insights into cryptocurrency markets and emerging technologies.
Our platform regularly explores topics including:
- Cryptocurrency technical analysis
- Blockchain innovation
- AI and digital technology trends
- Data-driven market research
If you enjoyed this analysis, continue exploring our growing collection of educational content.
By following One Web One Hub, you stay informed about the evolving digital economy while building deeper understanding of technology and financial markets.
Previous Post FARTCOINUSDT – Probability Analysis for March 06, 2026
Next Post FARTCOINUSDT – Probability Analysis for March 18, 2026


