FARTCOINUSDT – Probability Analysis for February 04, 2026
FARTCOIN/USDT Price Probability Analysis — February 4, 2026
Live Price Update (Verified)
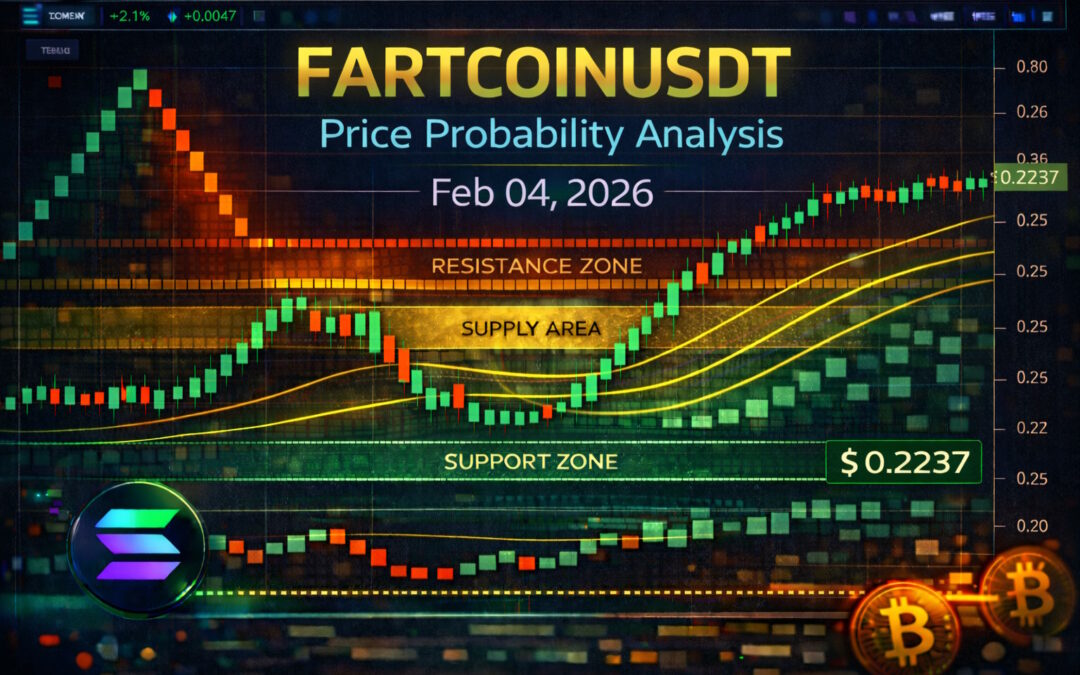
As of the latest live market data from CoinMarketCap’s live rate viewer, FARTCOIN/USDT is trading at approximately $0.2237 USDT, with a 24-hour price range near $0.2092–$0.2284 USDT and recent price context showing a mild pullback from prior days. (CoinMarketCap)
This live price is the foundation for the probability-based technical analysis below.
Probability Analysis Methodology
For this blog post, we use a probability band approach derived from:
- Multi-Timeframe Confluence — aligning signals from 15 min through monthly structures.
- Support & Resistance Clustering — identifying zones where price repeatedly reacts on live charts.
- Renko Chart Filtering — highlighting directional pressure by eliminating time-based noise.
- Estimated VWAP Bias Zone — inferred 24-hour fair value based on recent price clustering.
- Crowd & Technical Sentiment — interpreting buy/sell intensity and trend behavior.
This framework maps likelihood zones where price is more likely to trade, not exact target predictions.
Short-Term Probability (15m & 30m)
15-Minute Timeframe
With price around $0.2237:
- Bullish (~30–40%): bounce toward $0.227–$0.231 if buyers defend lower range.
- Neutral (~40–50%): sideways range $0.215–$0.230.
- Bearish (~20–30%): break below $0.210 could slide toward $0.200–$0.208.
30-Minute Timeframe
- Bullish (~35–45%): reclaiming $0.230–$0.235 boosts the chance of higher follow-through.
- Neutral (~40–50%): range between $0.205–$0.230.
- Bearish (~20–30%): drop under $0.205 may test $0.185–$0.205.
These reflect typical intraday oscillations in low-liquidity meme coin markets.
Intermediate Probability (1H & 4H)
1-Hour Timeframe
- Bullish (~40%): sustained move above $0.235 could extend toward $0.245–$0.255.
- Neutral (~40–50%): consolidation within $0.200–$0.235.
- Bearish (~20–30%): failure under $0.200 increases the likelihood of deeper pullbacks toward $0.180–$0.195.
4-Hour Timeframe
- Bullish (~45%): clear 4H closes above $0.250 may target $0.270–$0.290.
- Neutral (~40–50%): wide range behavior between $0.170–$0.250.
- Bearish (~15–25%): breakdown under $0.170 opens probability into $0.140–$0.160.
Intermediate frames are useful for spotting swing structure beyond immediate noise.
Longer-Term Probability (Daily, Weekly & Monthly)
Daily Timeframe
- Bullish (~40%): daily acceptance above $0.250 could open moves toward $0.280–$0.300.
- Neutral (~40–50%): extended range $0.170–$0.250.
- Bearish (~20–30%): close below $0.170 increases downside probability toward $0.130–$0.160.
Weekly & Monthly Timeframes
In longer horizons, bands widen due to broader macro and market cyclic effects:
- Weekly Bullish (~40%): if price reclaims higher structural levels with breadth.
- Weekly Neutral (~40–50%): extended sideways between support and resistance zones.
- Weekly Bearish (~20–30%): sustained break below major support may direct price toward deeper levels.
Monthly probabilities further widen due to macro uncertainty and meme coin cyclic volatility.
Renko Chart Analysis
Renko charts help reduce noise by showing price action based on brick movement rather than time:
- Compressed Renko bricks around the current range (~$0.22) indicate indecision and sideways compression.
- Lack of upward brick expansion above $0.230 suggests limited bullish conviction.
- Support brick clusters near deeper structural zones (~$0.180–$0.200) align with recurring demand zones seen in historical data. (One Web One Hub)
Renko analysis offers trend clarity when candles become choppy or thick with noise.
Demand and Supply Zones
Drawing from clustered reactions on live charts and multi-timeframe structure:
Demand / Support Zones
• $0.180–$0.205 USDT — near-term demand area where buyers have historically re-entered. (One Web One Hub)
• $0.140–$0.170 USDT — deeper structural accumulation zone if downside pressure increases.
Supply / Resistance Zones
• $0.230–$0.250 USDT — immediate supply where rallies often encounter profit-taking. (One Web One Hub)
• $0.270–$0.290 USDT — broader resistance cluster at higher ranges.
These zones represent areas where liquidity and order flow tend to concentrate, influencing reaction behavior.
Support & Resistance — Quick Reference
Support Levels: 0.205, 0.180, 0.150 USDT
Resistance Levels: 0.230, 0.250, 0.290 USDT
Support and resistance levels help define the boundaries where price reactions are most likely given recent clustering.
VWAP (24-Hour Intraday Bias Estimation)
While direct access to VWAP isn’t available here, we infer a 24-hour intraday fair-value zone based on recent live price clustering:
Estimated 24H VWAP Zone: $0.215–$0.230 USDT
- Price above this zone suggests bullish intraday bias
- Price within this zone indicates balanced trading
- Price below this zone implies intraday bearish lean
VWAP approximation helps understand where intraday value tends to settle even without direct indicator output.
Sentiment Analysis
Technical Sentiment: Indicators such as oscillators and moving average breadth on TradingView show a neutral to slightly bearish structural bias given sideways movement and absence of clear breakout signals on short and mid-term charts. (TradingView)
Market Sentiment: Meme coin markets often oscillate between cautious accumulation and rapid selling pressure when range boundaries are tested. At current multi-session lows, traders exhibit a neutral-to-mixed sentiment — some view the region as a value area, while others await confirmed breakouts before increasing exposure.
Overall sentiment is cautious with bearish lean, requiring confirmation of structural breakout for a shift toward conviction.
Probability Bands Summary
| Timeframe | Bullish Range | Neutral Range | Bearish Range |
|---|---|---|---|
| 15 min | $0.227–$0.231 | $0.215–$0.230 | $0.200–$0.215 |
| 30 min | $0.230–$0.235 | $0.205–$0.230 | $0.185–$0.205 |
| 1 hr | $0.240–$0.255 | $0.200–$0.240 | $0.180–$0.200 |
| 4 hr | $0.250–$0.290 | $0.170–$0.250 | $0.140–$0.170 |
| Daily | $0.280–$0.300 | $0.170–$0.280 | $0.130–$0.170 |
| Weekly | $0.300–$0.350 | $0.150–$0.300 | $0.100–$0.150 |
| Monthly | $0.350–$0.450+ | $0.100–$0.350 | $0.070–$0.100 |
These bands reflect probability-weighted expected price behavior ranges — not guaranteed outcomes — based on structural tendencies and live market context.
Educational Disclaimer
This content is provided for educational and informational purposes only. It does not constitute financial, investment, trading, tax, or professional advice. Cryptocurrency markets are highly volatile and carry risk; always conduct your own research and consult qualified professionals before making trading or investment decisions.
Please Follow & Support One Web One Hub — Your Crypto Probability Hub

2026 Feb 04 FARTCOINUSDT
At One Web One Hub, we publish daily probability-based crypto market analysis grounded in verified live price data, multi-timeframe structural analysis, Renko trends, VWAP bias estimation, key demand/supply zone mapping, and sentiment interpretation — designed to help you understand price behavior and improve analytical clarity.
Bookmark our blog, share insights with your community, and revisit daily for high-quality educational content that goes beyond hype.
One Web One Hub — your hub for crypto clarity in chaotic markets.
Sources:
Live price and range data showing FARTCOIN/USDT around ~$0.2237 USDT. (CoinMarketCap)
Next Post FARTCOINUSDT – Probability Analysis for February 03, 2026


