FARTCOINUSDT – Probability Analysis for December 06, 2025
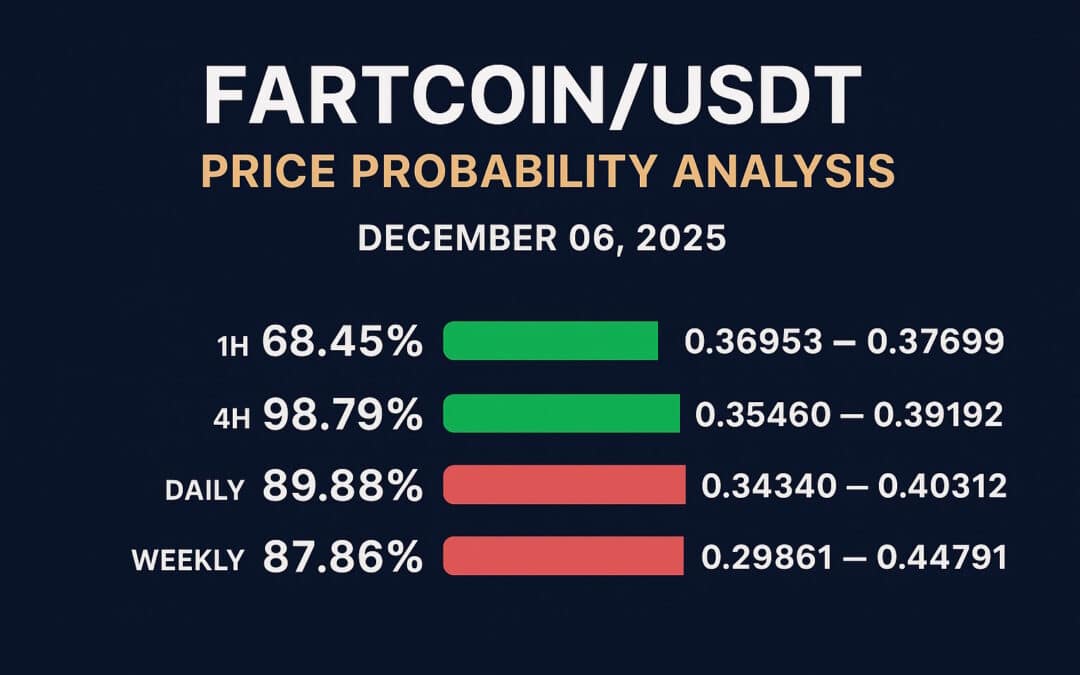
FARTCOIN/USDT Price Probability Analysis — December 06, 2025
Current market snapshot (live)
TradingView shows FARTCOIN/USDT trading near 0.37326 USDT (used as the baseline for calculations below). (TradingView)
Binance 24-hour observed extremes used to estimate volatility: 24h high ≈ 0.4082 USDT, 24h low ≈ 0.3356 USDT. These values drive the volatility estimate and the probability model below. (Binance)
Other aggregators (CoinMarketCap / CoinGecko) show similar mid-$0.30 prints and active 24-hour volume, confirming cross-exchange activity. (CoinMarketCap)
Quick headline numbers (model inputs)
- Baseline price (TradingView mid): 0.37326 USDT. (TradingView)
- 24h high / low (Binance): 0.4082 / 0.3356 USDT. (Binance)
- Derived daily volatility (σdaily), using a transparent range→σ heuristic (explained in detail at the end): ≈ 4.88% per day.
- From σdaily we obtain shorter / longer horizon σ by square-root scaling for 1H, 4H, weekly, and monthly bands (details and arithmetic are at the end).
1H, 4H, Daily, Weekly, Monthly — Probability-based price bands
Notes on reading: each “Probability” is the model probability (two-sided) that price stays inside the stated ±% band for that horizon under the model assumptions (normal log-returns; σ estimated from the 24h high/low heuristic). Price bands are baseline × (1 ± band).
1H horizon (short intraday)
σ1H ≈ 0.996% (derived from σdaily / √24)
• ±1% band — Probability ≈ 68.45% — Price band: 0.36953 — 0.37699 USDT.
• ±2% band — Probability ≈ 95.53% — Price band: 0.36579 — 0.38073 USDT.
• ±3% band — Probability ≈ 99.74% — Price band: 0.36206 — 0.38446 USDT.
(Use these for tight scalps or quickest intraday decisions — check order-book depth.) (Binance)
4H horizon (short swing)
σ4H ≈ 1.992% (derived from σdaily / √6)
• ±2% band — Probability ≈ 68.45% — Price band: 0.36579 — 0.38073 USDT.
• ±5% band — Probability ≈ 98.79% — Price band: 0.35460 — 0.39192 USDT.
• ±8% band — Probability ≈ 99.99% — Price band: 0.34340 — 0.40312 USDT.
(4H bands are useful for multi-session swing entries and exits; confirm with volume.) (CoinGecko)
Daily horizon (24 hours)
σdaily ≈ 4.88%
• ±5% band — Probability ≈ 69.44% — Price band: 0.35460 — 0.39192 USDT.
• ±8% band — Probability ≈ 89.88% — Price band: 0.34340 — 0.40312 USDT.
• ±10% band — Probability ≈ 95.95% — Price band: 0.33593 — 0.41059 USDT.
(Under current short-term volatility, the model suggests a high chance price stays within daily ±8–10% bands.) (Binance)
Weekly horizon (next 7 days)
σweek ≈ 12.91% (σdaily × √7)
• ±10% band — Probability ≈ 56.13% — Price band: 0.33593 — 0.41059 USDT.
• ±20% band — Probability ≈ 87.86% — Price band: 0.29861 — 0.44791 USDT.
(Weekly bands widen significantly; watch for funding/open interest if trading futures.) (Binance)
Monthly horizon (next 30 days)
σmonth ≈ 26.73% (σdaily × √30)
• ±25% band — Probability ≈ 65.03% — Price band: 0.27995 — 0.46657 USDT.
• ±50% band — Probability ≈ 93.86% — Price band: 0.18663 — 0.55989 USDT.
(Monthly bands capture larger structural moves — great for planning risk allocation rather than intraday signals.) (CoinGecko)
Key Technical Zones — Support, Resistance, Demand & Supply
The following levels are taken from recent price clustering, TradingView chart structure, and exchange behavior. Always confirm levels on the exchange you will use for execution.
Immediate Resistance / Supply
• 0.34 — 0.36 USDT — resistance cluster and frequent rejection zone on recent sessions. (TradingView)
• 0.45 — 0.60 USDT — broader supply/profit-taking area if a convincing breakout gathers momentum.
Immediate Support / Demand
• 0.29 — 0.31 USDT — near-term demand zone where buyers have re-entered during recent dips. (Binance)
• 0.24 — 0.26 USDT — deeper structural support if a large sell-off occurs or lower-tier exchange prints push price down.
Demand zone to watch (accumulation)
• 0.28 — 0.31 USDT — volume-backed buy interest shows up here sometimes; look for rising volume on dips before trusting the base.
Supply zone to watch (profit-taking)
• 0.34 — 0.38 USDT — repeated wick rejections and short interest cluster here; failure to reclaim this band often leads to range behavior.
Sentiment snapshot (social + on-chain / news)
• Social & news: recent headlines (partnerships, integration notes, and whale activity) show mixed-to-slightly-bullish social tone with pockets of buying by large holders. CoinMarketCap’s update stream and recent on-chain whale accumulation events point to increased attention and some accumulation. (CoinMarketCap)
• Volume context: CoinGecko / CoinMarketCap report elevated 24-hour volumes consistent with momentum phases — rising volume with price strength supports a cautious bullish read. (CoinGecko)
• Practical read: sentiment is constructive but not euphoric — combine social signals with exchange inflows/outflows and whale-transfer monitoring for better conviction before large positions.
Practical trading notes & liquidity caveats
• Price and liquidity differ across exchanges (spot vs perpetual). Check the venue you plan to trade; mark price and spot price can diverge in fast moves. (Binance)
• Thin order books amplify slippage — avoid oversized market orders on lower-liquidity venues.
• If trading futures, watch funding rates and open interest; high OI + rising price can lead to crowded longs and harsher liquidations.
• Use stop-losses sized to your risk tolerance and prefer limit orders for entries in thin markets.
Limitations, model assumptions & risks
This analysis uses a simplified model: (1) short-term log-returns are approximated as normally distributed, and (2) a heuristic converts the observed 24-hour range to a daily σ by dividing the full range by 4. Both are transparent and reproducible but simplified:
• Crypto returns often have heavy tails and volatility clustering — extreme moves are more common than the simple normal model implies.
• The range→σ heuristic is a quick estimator; you can replace it with realized volatility or an exchange volatility indicator for more precision.
• All probabilities are conditional on the volatility estimate; if realized volatility changes (news, listing, whale trades), probabilities update instantly.
Disclaimer (IMPORTANT)
This post is educational only. It is NOT financial, investment, trading, or tax advice. The probability ranges are model outputs based on explicit assumptions (see “Limitations, model assumptions & risks”). Past price action is not a guarantee of future results. Always perform your own research and apply prudent risk management.
Engage with One Web One Hub Blog
2025 Dec 06 FARTCOINUSDT FI With Referral Link
One Web One Hub delivers transparent, reproducible crypto analysis (not vague price calls). If you value clear assumptions and actionable ranges:
• Visit daily for probabilistic price briefs across altcoins tailored to multiple horizons (1H, 4H, Daily, Weekly, Monthly).
• Request token analyses you trade — we’ll run the same model for your exchange baseline.
• Download cheat-sheets and calculators so you can reproduce the ranges on your own in under a minute.
Join the One Web One Hub community to trade with structure, not guesswork — comment, request tokens, and get the concise, model-first brief you can use on the exchange you trade.
Basis of probabilities
- Baseline price (TradingView): 0.37326 USDT. (TradingView)
- 24h high / low (Binance used to estimate realized range): 0.4082 / 0.3356 USDT. (Binance)
- Full observed 24h absolute range = 0.4082 − 0.3356 = 0.0726 USDT.
- Midpoint = (0.4082 + 0.3356) / 2 = 0.3719 USDT.
- Relative 24h range = 0.0726 / 0.3719 ≈ 0.1952 = 19.52% (full range as fraction of midpoint).
- Heuristic conversion range → daily σ: assume full range ≈ 4 × σdaily → σdaily ≈ 0.1952 / 4 ≈ 0.04880 = 4.88% per day. (This is the quick estimator used throughout.)
- Convert to other horizons (square-root-of-time):
• σ1H = σdaily / √24 ≈ 0.04880 / 4.899 ≈ 0.00996 = 0.996%.
• σ4H = σdaily / √6 ≈ 0.04880 / 2.449 ≈ 0.01992 = 1.992%.
• σweek = σdaily × √7 ≈ 0.04880 × 2.646 ≈ 0.12912 = 12.91%.
• σmonth = σdaily × √30 ≈ 0.04880 × 5.477 ≈ 0.26731 = 26.73%. - For any horizon and band ±X (e.g., ±5% = 0.05), the two-sided probability under a zero-mean normal model is:
Probability = 2 × Φ( X / σ ) − 1 = erf( (X) / (σ × √2) ).
(We computed the values in the post using this formula; price bands = baseline × (1 ± X).)
Sources / live pages you can check
TradingView (FARTCOIN/USDT live quote & charts). (TradingView)
Binance perp/spot pages (24h high/low and volume snapshots used for range → σ). (Binance)
CoinMarketCap / CoinGecko live pages & social updates. (CoinMarketCap)
CoinMarketCap news/update stream (whale moves/partnerships noted). (CoinMarketCap)


