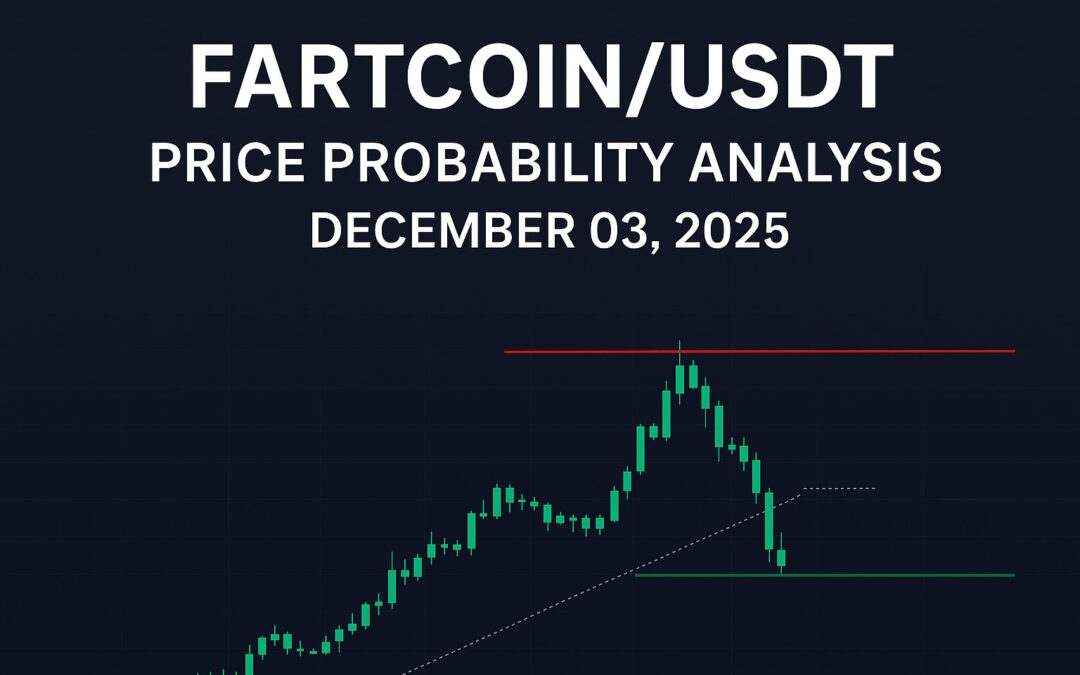
FARTCOINUSDT – Probability Analysis for December 03, 2025
FARTCOINUSDT Price Probability Analysis — December 03, 2025
Current Market Snapshot
TradingView shows a current mid price for FARTCOIN/USDT around 0.32563 USDT (used as the baseline for the numbers below). (TradingView)
Binance 24-hour statistics used for volatility estimation show a 24h high around 0.3949 USDT and a 24h low around 0.2868 USDT. These observed extremes inform our short-term volatility estimate. (Binance)
Other market aggregators (CoinMarketCap, CoinGecko) report similar mid-$0.30 price levels, confirming active liquidity and spread across venues. (CoinMarketCap)
Basis of the Probability Model (explicit, reproducible)
Reference price (baseline)
We use the TradingView mid price 0.32563 USDT as the baseline for price band arithmetic. (TradingView)
Short-term volatility estimate (step-by-step)
We estimate daily volatility from the observed 24-hour high / low (Binance) with a simple, transparent heuristic:
-
24h high − 24h low = 0.3949 − 0.2868 = 0.1081 USDT. (Binance)
-
Midpoint of high & low = (0.3949 + 0.2868) / 2 = 0.34085 USDT. (Binance)
-
Relative 24h range = 0.1081 / 0.34085 = ≈ 0.31715 → 31.71% (full observed range as a fraction of midpoint).
-
Heuristic conversion range → σ (standard deviation): use range ≈ 4 × σ (common rule-of-thumb). So estimated daily σ ≈ 0.31715 / 4 = 0.07929 → ≈ 7.93% daily volatility.
This approach is transparent and reproducible; alternate volatility measures (realized volatility from intraday returns or exchange-quoted volatility indicators) may be used instead for different precision. (Binance)
Statistical model
We model short-term log-returns as approximately normal (a simplifying but common choice). Weekly and monthly σ scale using the square-root-of-time rule:
• σweek = σdaily × sqrt(7) ≈ 7.93% × √7 ≈ 20.98%.
• σmonth = σdaily × sqrt(30) ≈ 7.93% × √30 ≈ 43.43%.
Using these σ values we compute probabilities that returns stay within ±X% bands under the normal assumption. These are model outputs (likelihoods under stated assumptions), not guarantees.
Probability-Based Price Ranges (baseline = 0.32563 USDT)
(Notation: “Probability” = model probability that price stays inside the band over the horizon.)
Daily (next 24 hours — σdaily ≈ 7.93%)
• ±5% band
• Probability ≈ 47.17% that price remains within ±5%.
• Price band ≈ 0.30935 — 0.34191 USDT (0.32563 × (1 ± 0.05)).
• ±8% band
• Probability ≈ 68.70% that price remains within ±8%.
• Price band ≈ 0.29958 — 0.35168 USDT (0.32563 × (1 ± 0.08)).
• ±10% band
• Probability ≈ 79.28% that price remains within ±10%.
• Price band ≈ 0.29307 — 0.35819 USDT (0.32563 × (1 ± 0.10)).
(Interpretation: under current short-term volatility, the model gives roughly a ~69% chance that price will stay within ±8% of 0.32563 over the next 24 hours.)
Sources used: TradingView price baseline and Binance 24h extremes. (TradingView)
Weekly (next 7 days — σweek ≈ 20.98%)
• ±10% band
• Probability ≈ 36.64% that price stays within ±10% over 7 days.
• Price band ≈ 0.29307 — 0.35819 USDT.
• ±20% band
• Probability ≈ 65.96% that price stays within ±20% over 7 days.
• Price band ≈ 0.26050 — 0.39076 USDT.
Monthly (next 30 days — σmonth ≈ 43.43%)
• ±25% band
• Probability ≈ 43.52% that price stays within ±25% over 30 days.
• Price band ≈ 0.24422 — 0.40704 USDT.
• ±50% band
• Probability ≈ 75.04% that price stays within ±50% over 30 days.
• Price band ≈ 0.16282 — 0.48845 USDT.
Notes about interpretation: these probabilities are conditional on the volatility estimate above and the normal-returns assumption. If realized volatility rises (news, listing, whale trades), probabilities change rapidly.
Key Technical Zones — Support, Resistance, Demand & Supply
The following levels are drawn from recent clustering on TradingView and high/low behaviour across major exchanges (Binance, Bybit, KCEX, etc.). Always confirm levels on the exchange you trade.
Immediate Resistance / Supply
• 0.34 — 0.36 USDT — visible recent rejection and clustering near upper ranges. (TradingView)
• 0.45 — 0.60 USDT — broader supply/profit-taking band if a convincing breakout occurs (liquidity may thin above this region). (CoinMarketCap)
Immediate Support / Demand
• 0.29 — 0.31 USDT — near-term support cluster where buyers stepped in during recent dips. (TradingView)
• 0.24 — 0.26 USDT — deeper structural support in a strong down move or when liquidity shifts on lower-tier exchanges. (Binance)
Demand Zone (watch for accumulation)
• 0.28 — 0.31 USDT — good area to monitor for dip buying and volume confirmation.
Supply Zone (watch for profit-taking)
• 0.34 — 0.38 USDT — area that has repeatedly produced sell pressure and rejection wicks.
Liquidity & Practical Trading Notes
• FARTCOIN liquidity and quoted price vary across exchanges; perpetual/futures mark prices can differ from spot prices — always verify pricing on the venue you trade. (Binance)
• Order-book depth matters: thin books amplify price moves. Check open interest/funding if trading futures. (cryptometer.io)
• Use reasonable position sizing, predefined stops, and avoid executing large market orders into thin liquidity.
Model Limitations & Risk Warnings
• The normal-returns assumption and constant-σ scaling are simplifications. Crypto returns commonly display volatility clustering and fat tails; extreme moves occur more often than a pure normal model implies. (CoinGecko)
• Exchange outages, significant news, tokenomics updates, or large whale trades can make these probability ranges invalid in minutes. Use them as planning tools — not guarantees.
Educational Disclaimer (VERY IMPORTANT)
This content is for educational purposes only. It is NOT financial, investment, trading, or tax advice. The probability ranges are model outputs based on explicit, stated assumptions (see “Basis of the Probability Model”). Past performance is not a guarantee of future results. Always perform your own research and manage risk appropriately.
Engage with One Web One Hub
2025 Dec 03 FARTCOINUSDT FI With Referral Link
If you value transparent, assumption-driven crypto analysis (not opaque predictions), visit One Web One Hub daily. We provide:
• Reproducible, volatility-based probability ranges for tokens you care about.
• Clear support/resistance and demand/supply zones that map to real exchange behaviour.
• Weekly deep dives combining on-chain signals, funding/open interest checks, and the probability framework shown here.
Join the community, request the tokens you trade, and get daily briefs that you can apply directly to the exchange you use. Engaging with our content helps you trade with structure, not guesswork.
Sources / Live pages checked (verify any number yourself)
• TradingView — FARTCOIN / USDT live quotes & markets. (TradingView)
• Binance — 24h high/low / futures pages used for volatility estimate. (Binance)
• CoinMarketCap — live aggregate price & market-cap snapshot. (CoinMarketCap)
• CoinGecko — news snapshots and whale activity context. (CoinGecko)
• Cryptometer / live orderbook snapshots for liquidity checks. (cryptometer.io)


