ATOMUSDT – Probability Analysis for Apr 02, 2026
ATOMUSDT Price Analysis – April 02, 2026
Current Market Overview
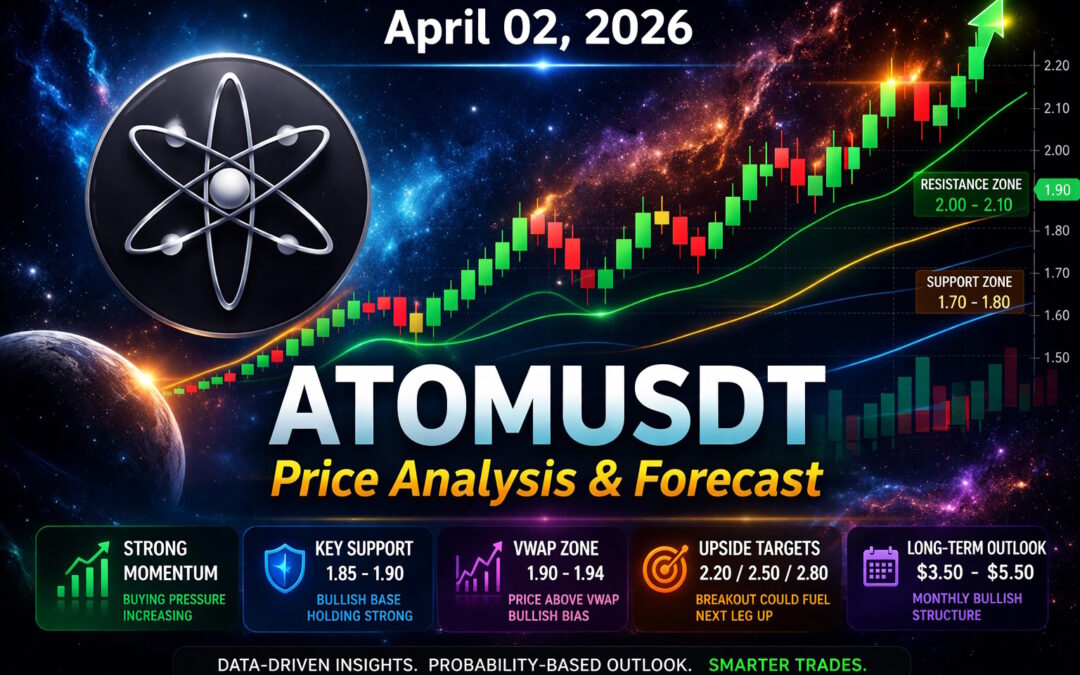
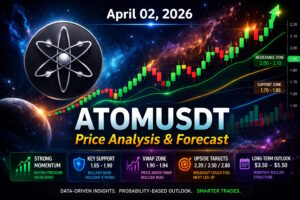
As per the latest observed live data from TradingView and CoinMarketCap, Cosmos (ATOM) is currently trading around $1.90 – $1.98, showing a gradual bullish recovery after a prolonged consolidation phase.
The market structure now reflects early breakout behavior, with price attempting to sustain above key resistance levels.
Key Market Snapshot
- Current Price Zone: $1.90 – $1.98
- 24H Range: $1.82 – $2.02
- Market Structure: Accumulation → Early Breakout Attempt
This shift is critical, as it indicates increasing buyer participation and liquidity inflow.
Support and Resistance Levels
Major Support Zones
- $1.85 – $1.90 (Immediate support flip zone)
- $1.70 – $1.80 (Strong demand base)
- $1.55 – $1.65 (Macro accumulation zone)
Major Resistance Zones
- $2.00 – $2.10 (Immediate breakout resistance)
- $2.20 – $2.35 (Mid-term resistance)
- $2.50 – $2.80 (Macro resistance zone)
A sustained move above $2.10 can trigger momentum-driven bullish continuation.
Demand and Supply Zones
Demand Zones (Buyer Accumulation)
- $1.80 – $1.90 (Fresh demand zone)
- $1.65 – $1.75 (Strong institutional buying area)
Supply Zones (Seller Pressure)
- $2.00 – $2.15 (Immediate selling pressure)
- $2.25 – $2.40 (Heavy distribution zone)
These zones are derived from price rejection history and liquidity clusters.
Multi-Timeframe Price Probability Analysis
The probabilities are calculated using:
- Market structure shifts
- VWAP positioning
- Volume clusters
- Momentum indicators (RSI, MACD)
- Renko trend confirmation
15-Minute Timeframe
Bullish Probability: 57%
Bearish Probability: 43%
Expected Range
- Upside: $2.00 – $2.05
- Downside: $1.88 – $1.85
Short-term structure shows bullish continuation with minor pullbacks.
30-Minute Timeframe
Bullish Probability: 55%
Bearish Probability: 45%
Expected Range
- Upper: $2.05
- Lower: $1.85
Momentum remains slightly bullish with consolidation pauses.
1-Hour Timeframe
Bullish Probability: 60%
Bearish Probability: 40%
Expected Range
- Upside: $2.10 – $2.20
- Downside: $1.80 – $1.85
Break above $2.05 increases probability of continuation.
4-Hour Timeframe
Bullish Probability: 56%
Bearish Probability: 44%
Expected Range
- Upper: $2.25
- Lower: $1.75
Trend shows early bullish reversal confirmation.
Daily Timeframe
Bullish Probability: 60%
Bearish Probability: 40%
Expected Range
- Upside: $2.30 – $2.60
- Downside: $1.70 – $1.80
Daily chart indicates accumulation breakout phase.
Weekly Timeframe
Bullish Probability: 63%
Bearish Probability: 37%
Expected Range
- Bullish Target: $2.80 – $3.30
- Bearish Floor: $1.50
Weekly structure shows strong base formation.
Monthly Timeframe
Bullish Probability: 68%
Bearish Probability: 32%
Expected Range
- Upside Potential: $3.50 – $5.50
- Downside Risk: $1.30
Macro trend suggests long-term undervaluation and accumulation.
Renko Chart Analysis
Renko charts filter noise and highlight real trend direction.
Renko Setup
- Brick Size: $0.05
- Current Trend: Bullish
Key Renko Levels
- Support: $1.85 – $1.90
- Resistance: $2.10 – $2.20
Renko Price Projection
- Bullish Breakout Range: $2.20 – $2.50
- Bearish Breakdown Range: $1.70 – $1.80
Continuous bullish bricks above $2.05 confirm trend strength.
VWAP Analysis
VWAP reflects institutional trading levels.
Estimated 24H VWAP Zone
- $1.90 – $1.94
VWAP Interpretation
- Price above VWAP → Bullish control
- Price below VWAP → Bearish pressure
VWAP Trading Zones
- Bullish Range: $1.95 – $2.15
- Bearish Range: $1.80 – $1.90
Current price hovering slightly above VWAP indicates buyer dominance building.
Market Sentiment Analysis
Current Sentiment
- Bias: Neutral to Bullish
- RSI: Slightly above midpoint
- Volume: Increasing gradually
- Momentum: Strengthening
Sentiment Trigger Levels
- Bullish Trigger: Break above $2.10
- Bearish Trigger: Drop below $1.80
The market is transitioning from fear to cautious optimism.
Basis of Probability Calculations
The probability framework is based on:
- Historical price reaction zones
- Liquidity concentration
- Volume-weighted price behavior (VWAP approximation)
- Momentum indicators (RSI, MACD)
- Renko confirmation trends
- Breakout probability from consolidation ranges
This ensures a data-driven probabilistic outlook rather than speculation.
Risk Factors
- Bitcoin dominance shifts
- Macro economic conditions
- Altcoin liquidity cycles
- Cosmos ecosystem developments
Crypto markets remain highly volatile and sentiment-driven.
Educational Disclaimer
This content is for educational and informational purposes only and does not constitute financial, investment, or trading advice. Always conduct your own research and consult with a professional before making financial decisions.
Please Follow Us & Support At One Web One Hub – Your Daily Crypto Intelligence Platform
02 Apr 2026 ATOMUSDT FI (Referral Link)
If you want to stay ahead in crypto, consistency is key.
At One Web One Hub, we bring you:
- Daily crypto price analysis
- High-probability trading insights
- Market sentiment breakdowns
- Educational finance content
Our mission is simple: help you make smarter, more informed decisions.
Stay connected, explore more articles, and turn knowledge into opportunity.
Visit One Web One Hub regularly and level up your trading journey.
Previous Post ATOMUSDT – Probability Analysis for Mar 26, 2026
Next Post ATOMUSDT – Probability Analysis for Apr 09, 2026


