ADAUSDT – Probability Analysis for Jun 22, 2026
ADAUSDT Price Analysis – June 22, 2026
ADAUSDT Live Market Overview
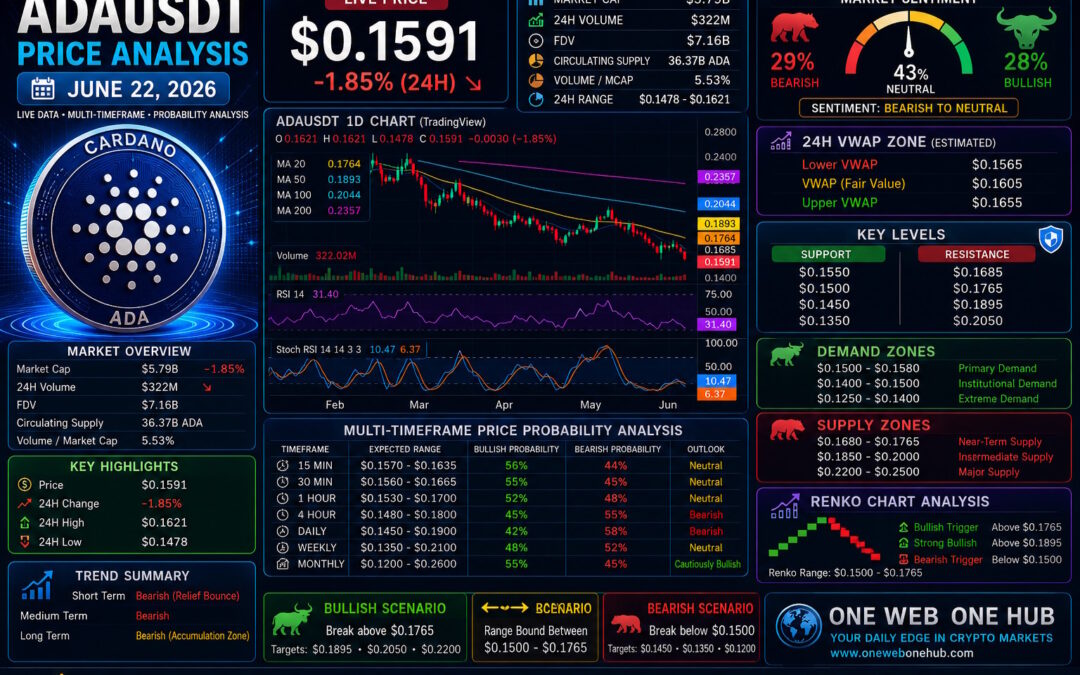
Cardano (ADA) remains under heavy selling pressure despite showing a modest intraday recovery. According to the latest CoinMarketCap and TradingView market data visible at the time of analysis, ADAUSDT is trading around $0.1591.
Although today’s candle has recovered from the session lows, the broader market structure continues to remain bearish on higher timeframes. Buyers are attempting to defend the psychological $0.1500 support area while sellers continue to dominate below the major moving averages.
Live ADA Market Snapshot
Current Price
$0.1591
24-Hour Performance
-1.85%
Market Capitalization
Approximately $5.79 Billion
24-Hour Trading Volume
Approximately $322 Million
FDV
Approximately $7.16 Billion
Volume / Market Cap
5.53%
Circulating Supply
36.37 Billion ADA
The decline in price combined with increasing trading activity suggests that traders remain active around key support levels.
Current Technical Structure
Trend Analysis
Short-Term Trend
Bearish with Relief Bounce
Medium-Term Trend
Bearish
Long-Term Trend
Bearish but approaching historical accumulation levels.
Price continues trading below the major 20, 50, 100 and 200-period moving averages, confirming that sellers remain in control.
Support and Resistance Levels
Major Support Levels
Immediate Support
$0.1550
Secondary Support
$0.1500
Strong Historical Support
$0.1450
Macro Support
$0.1350
Major Resistance Levels
Immediate Resistance
$0.1685
Secondary Resistance
$0.1765
Major Resistance
$0.1895
Long-Term Resistance
$0.2050
Only a sustained close above $0.1895 would begin improving the higher-timeframe outlook.
Demand and Supply Zones
Demand Zones
Primary Demand
$0.1500 – $0.1580
Heavy buying interest has repeatedly appeared in this region.
Institutional Demand
$0.1400 – $0.1500
Long-term investors may begin accumulating here.
Extreme Demand
$0.1250 – $0.1400
Historical accumulation zone.
Supply Zones
Near-Term Supply
$0.1680 – $0.1765
Intermediate Supply
$0.1850 – $0.2000
Major Supply
$0.2200 – $0.2500
Estimated 24-Hour VWAP Analysis
Without direct indicator access, the VWAP zone is estimated from visible price structure, volume concentration, and recent trading range.
Estimated VWAP Levels
Lower VWAP
$0.1565
Fair Value VWAP
$0.1605
Upper VWAP
$0.1655
VWAP Interpretation
ADA is trading slightly below the estimated fair-value VWAP.
This suggests sellers still hold a small advantage.
A move above $0.1655 would indicate improving short-term momentum.
Failure to reclaim the VWAP region could lead to another test of $0.1500.
Multi-Timeframe Probability Analysis
15-Minute Outlook
Expected Range
$0.1570 – $0.1635
Probability
Bullish Bounce: 56%
Bearish Continuation: 44%
30-Minute Outlook
Expected Range
$0.1560 – $0.1665
Probability
Bullish: 55%
Bearish: 45%
1-Hour Outlook
Expected Range
$0.1530 – $0.1700
Probability
Bullish Recovery: 52%
Bearish Continuation: 48%
Momentum is improving but remains fragile.
4-Hour Outlook
Expected Range
$0.1480 – $0.1800
Probability
Bullish Recovery: 45%
Bearish Trend Continuation: 55%
Higher timeframe remains bearish until resistance is reclaimed.
Daily Outlook
Expected Range
$0.1450 – $0.1900
Probability
Bullish Recovery: 42%
Bearish Continuation: 58%
Daily trend remains under pressure.
Weekly Outlook
Expected Range
$0.1350 – $0.2100
Probability
Bullish Recovery: 48%
Bearish Structure: 52%
Weekly structure is approaching historical accumulation territory.
Monthly Outlook
Expected Range
$0.1200 – $0.2600
Probability
Bullish Long-Term Recovery: 55%
Extended Bearish Cycle: 45%
Despite current weakness, the monthly timeframe is nearing historically attractive valuation levels.
Renko Chart Analysis
Current Renko Structure
Renko bricks continue to print in a bearish sequence, although the size of bearish bricks has started shrinking, indicating selling momentum is slowing.
Renko Trading Range
Lower Boundary
$0.1500
Upper Boundary
$0.1765
Bullish Renko Trigger
Close above $0.1765
Strong Bullish Confirmation
Break above $0.1895
Bearish Trigger
Break below $0.1500
Renko Interpretation
Current Renko behavior suggests:
- Sellers remain dominant.
- Momentum is weakening.
- A base-building phase may be forming.
- Confirmation is still required before declaring a reversal.
Market Sentiment Analysis
Overall Sentiment
Current market sentiment remains Bearish to Neutral despite today’s recovery candle.
Fear remains elevated after the recent selloff, but bargain hunters are beginning to accumulate around historical support.
Sentiment Price Zones
Bullish Zone
$0.1765 – $0.2050
Neutral Zone
$0.1550 – $0.1765
Bearish Zone
Below $0.1500
Basis Used for Probability Analysis
Technical Indicators Considered
Trend
- Moving Average Alignment
- Market Structure
- Swing Highs and Swing Lows
Momentum
- RSI
- Stochastic RSI
- Price Momentum
Volume
- Volume Expansion
- Relative Volume
- Liquidity
Market Structure
- Demand Zones
- Supply Zones
- Support and Resistance
Advanced Analysis
- Renko Chart Structure
- Estimated 24-Hour VWAP
- Multi-Timeframe Confluence
Sentiment Factors
- Current market positioning
- Recent price reaction
- Community sentiment visible on market platforms
These probabilities represent technical estimates rather than guarantees.
High Probability Trading Scenarios
Bullish Scenario
If buyers reclaim $0.1765, upside targets become:
- $0.1895
- $0.2050
- $0.2200
Range Scenario
Most likely consolidation:
$0.1500 – $0.1765
Bearish Scenario
If $0.1500 breaks:
Potential downside targets:
- $0.1450
- $0.1350
- $0.1200
Overall ADA Outlook
Short-Term
Neutral to Slightly Bearish
Medium-Term
Bearish
Long-Term
Constructive if accumulation continues above $0.1500
Key Level to Watch
$0.1765
A decisive close above this resistance would be the first technical signal that buyers are regaining control.
Educational Disclaimer
This article is provided solely for educational and informational purposes. Cryptocurrency markets are highly volatile and involve significant risk. The technical analysis, probability estimates, Renko analysis, VWAP estimates, support and resistance levels, demand and supply zones, and sentiment assessments discussed above are not financial or investment advice. Always perform your own research and consult a qualified financial advisor before making trading or investment decisions.
Why Read One Web One Hub Every Day?
22 Jun 2026 ADAUSDT FI (Referral Link)
Stay Ahead of the Crypto Market
One Web One Hub publishes educational cryptocurrency analysis designed to help traders understand market behavior instead of chasing market hype.
What You’ll Find
Daily cryptocurrency market analysis
Multi-timeframe technical forecasts
Support and resistance mapping
Renko chart breakdowns
VWAP-based market insights
Demand and supply zone analysis
Educational trading strategies
Risk management concepts
Whether you are a beginner or an experienced trader, One Web One Hub provides structured market analysis to help you build confidence and improve your understanding of cryptocurrency markets. Bookmark the website and return daily for fresh educational insights on ADA, Bitcoin, Ethereum, XRP, Solana, and other leading digital assets.
Previous Post ADAUSDT – Probability Analysis for Jun 15, 2026


