XRPUSDT – Probability Analysis for Jun 21, 2026
XRP Price Analysis – June 21, 2026
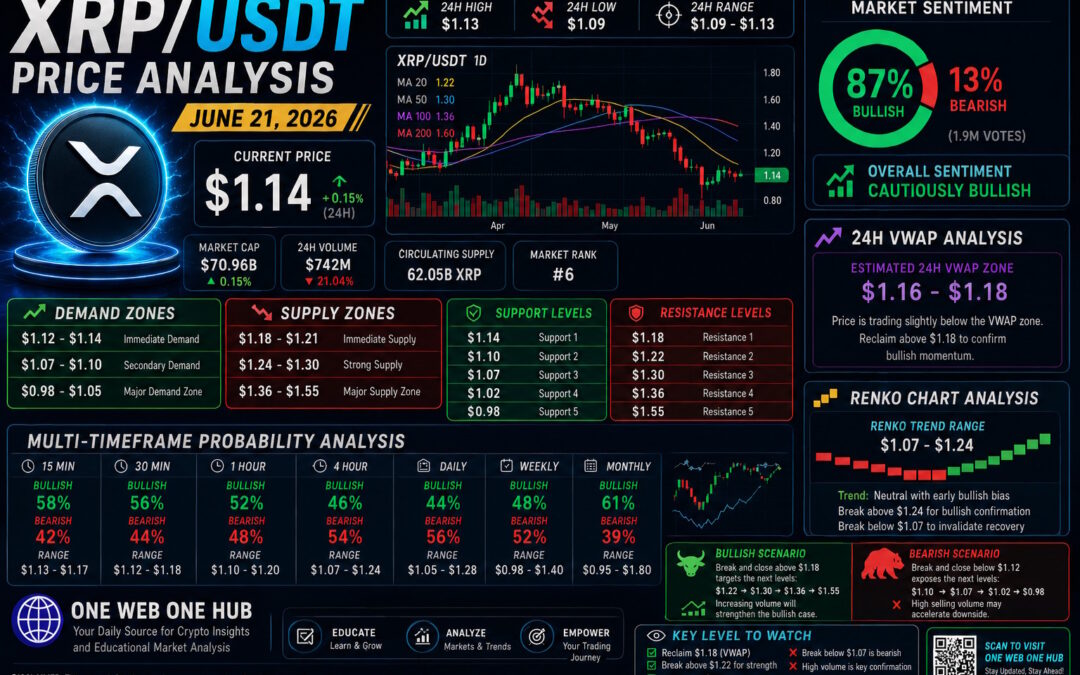
XRP Holds Above $1.14 as Buyers Defend Critical Demand Zone
XRPUSDT enters the third week of June trading around the $1.14 region after recovering from a sharp sell-off that briefly pushed price close to $1.07. Buyers have successfully defended the immediate demand zone, but XRP continues trading beneath its major moving averages, leaving the medium-term trend neutral-to-bearish until stronger confirmation appears.
The current structure suggests the market is attempting to establish a short-term bottom while institutional traders monitor whether XRP can reclaim the intraday VWAP and higher resistance clusters.
Current Market Overview
Live Market Snapshot
Current Price: Approximately $1.14
24H Change: +0.15%
Market Capitalization: Approximately $70.96 Billion
24H Trading Volume: Approximately $742 Million
Circulating Supply: 62.05 Billion XRP
Market Rank: #6
Overall Trend:
Short-term recovery inside a larger corrective trend.
Technical Market Structure
Trend Analysis
The chart currently shows:
- Price remains below the 100 EMA
- Price remains below the 200 EMA
- 20 EMA and 50 EMA continue pointing downward
- Bollinger Bands are beginning to contract following the recent selloff
- Recovery volume remains moderate rather than explosive
This combination normally indicates:
- Selling pressure is weakening.
- Buyers are beginning accumulation.
- Trend reversal has not yet been confirmed.
Current Structure:
Short-Term: Neutral
Medium-Term: Bearish
Long-Term: Neutral
Demand Zones
Immediate Demand
$1.12 – $1.14
Institutional buyers defended this region during the recent decline.
Secondary Demand
$1.07 – $1.10
Strong bounce originated here.
Failure below this level could trigger another wave of liquidation.
Major Demand Zone
$0.98 – $1.05
Long-term buyers are expected to become highly active.
Supply Zones
Immediate Supply
$1.18 – $1.21
First area where sellers may return.
Strong Supply
$1.24 – $1.30
Confluence of moving averages and previous breakdown level.
Major Supply Zone
$1.36 – $1.55
Heavy institutional distribution area.
Support and Resistance
Major Supports
Support 1:
$1.14
Support 2:
$1.10
Support 3:
$1.07
Support 4:
$1.02
Support 5:
$0.98
Major Resistances
Resistance 1:
$1.18
Resistance 2:
$1.22
Resistance 3:
$1.30
Resistance 4:
$1.36
Resistance 5:
$1.55
Price Probability Analysis
15 Minute Outlook
Bullish Probability:
58%
Bearish Probability:
42%
Expected Range:
$1.13–$1.17
Reasoning:
- Recovery candles forming
- Momentum improving
- Buyers defending local support
30 Minute Outlook
Bullish Probability:
56%
Bearish Probability:
44%
Expected Range:
$1.12–$1.18
Price is attempting to build higher lows.
1 Hour Outlook
Bullish Probability:
52%
Bearish Probability:
48%
Expected Range:
$1.10–$1.20
Momentum remains balanced until resistance breaks.
4 Hour Outlook
Bullish Probability:
46%
Bearish Probability:
54%
Expected Range:
$1.07–$1.24
Trend remains under pressure while below the 50 EMA.
Daily Outlook
Bullish Probability:
44%
Bearish Probability:
56%
Expected Range:
$1.05–$1.28
Daily structure still reflects the prior corrective move.
Weekly Outlook
Bullish Probability:
48%
Bearish Probability:
52%
Expected Range:
$0.98–$1.40
A sustained close above $1.30 would improve the weekly outlook.
Monthly Outlook
Bullish Probability:
61%
Bearish Probability:
39%
Expected Range:
$0.95–$1.80
Long-term trend remains constructive despite recent weakness.
Renko Chart Analysis
Current Renko Structure
Estimated Renko Trend Range:
$1.07–$1.24
Current observation:
- Previous bearish bricks have slowed.
- Initial bullish reversal bricks are beginning to appear.
- Confirmation requires a move above $1.24.
- Failure below $1.07 would invalidate the recovery attempt.
Renko Signal:
Neutral with early bullish bias.
24-Hour VWAP Analysis
Estimated Institutional VWAP Zone
Estimated VWAP:
$1.16–$1.18
Current Position:
Price remains slightly below the estimated VWAP zone.
Interpretation:
- Institutions may still be selling into rallies.
- A reclaim and hold above $1.18 would indicate improving buyer control.
- Remaining below VWAP favors cautious trading.
Sentiment Analysis
Market Psychology
Current sentiment is improving but remains cautious.
Estimated Market Sentiment
Bullish:
55%
Bearish:
45%
Reasons supporting bulls:
- Demand zone holding
- Selling pressure decreasing
- Community sentiment remains optimistic
- XRP continues attracting long-term holders
Risks:
- Trading below higher-timeframe moving averages
- Resistance between $1.18–$1.30 remains significant
- Macro crypto volatility could pressure altcoins
Basis of Probability Calculations
Technical Factors Used
The probability estimates combine multiple technical factors rather than relying on a single indicator.
Inputs include:
- Multi-timeframe trend structure
- Support and resistance confluence
- Demand and supply zones
- Relative Strength Index (RSI)
- Stochastic RSI momentum
- Bollinger Band expansion/contraction
- Moving Average alignment (20, 50, 100, 200 EMA)
- Estimated institutional 24-hour VWAP
- Renko trend structure
- Trading volume behavior
- Market sentiment
- Overall cryptocurrency market conditions
Using multiple indicators together reduces reliance on any single signal and provides a more balanced probability assessment.
Trading Scenarios
Bullish Scenario
A breakout above $1.18 could target:
- $1.22
- $1.30
- $1.36
- $1.55
Increasing volume would strengthen this outlook.
Bearish Scenario
Failure to hold $1.12 may expose:
- $1.10
- $1.07
- $1.02
- $0.98
A break below $1.07 would likely accelerate selling pressure.
Key Levels to Watch This Week
Bullish Triggers
- Hold above $1.14
- Break above $1.18
- Reclaim estimated VWAP
- Close above $1.22 with strong volume
Bearish Triggers
- Loss of $1.12
- Break below $1.07
- Continued rejection at VWAP
- Increasing selling volume
Educational Disclaimer
This article is published solely for educational and informational purposes. Cryptocurrency markets are highly volatile, and all probability estimates represent technical analysis rather than guarantees of future price movements. Always conduct your own research, evaluate your risk tolerance, and consult a qualified financial professional before making investment decisions. Nothing contained in this article constitutes financial, investment, legal, or tax advice.
Continue Learning with One Web One Hub
Jun 21 2026 XRPUSDT (Referral Link)
Stay Ahead of the Crypto Market
Successful traders rely on consistent education rather than isolated predictions. At One Web One Hub, we publish in-depth XRP, Bitcoin, Ethereum, Solana, and broader cryptocurrency market analysis designed to help readers understand technical structures, institutional behavior, and evolving market trends.
Whether you are a beginner learning chart analysis or an experienced trader refining your strategy, our regularly updated educational content provides practical insights into support and resistance, demand and supply zones, Renko analysis, VWAP interpretation, sentiment tracking, and multi-timeframe probability assessments.
Bookmark One Web One Hub, explore our growing library of crypto education, and return regularly for fresh market outlooks that help you make more informed trading decisions while strengthening your understanding of digital asset markets.
Previous Post XRPUSDT – Probability Analysis for Jun 14, 2026


