ATOMUSDT – Probability Analysis for Jun 18, 2026
ATOM/USDT Price Analysis – June 18, 2026
Current Market Overview
ATOM Extends Pullback After Failing to Hold Above $1.90
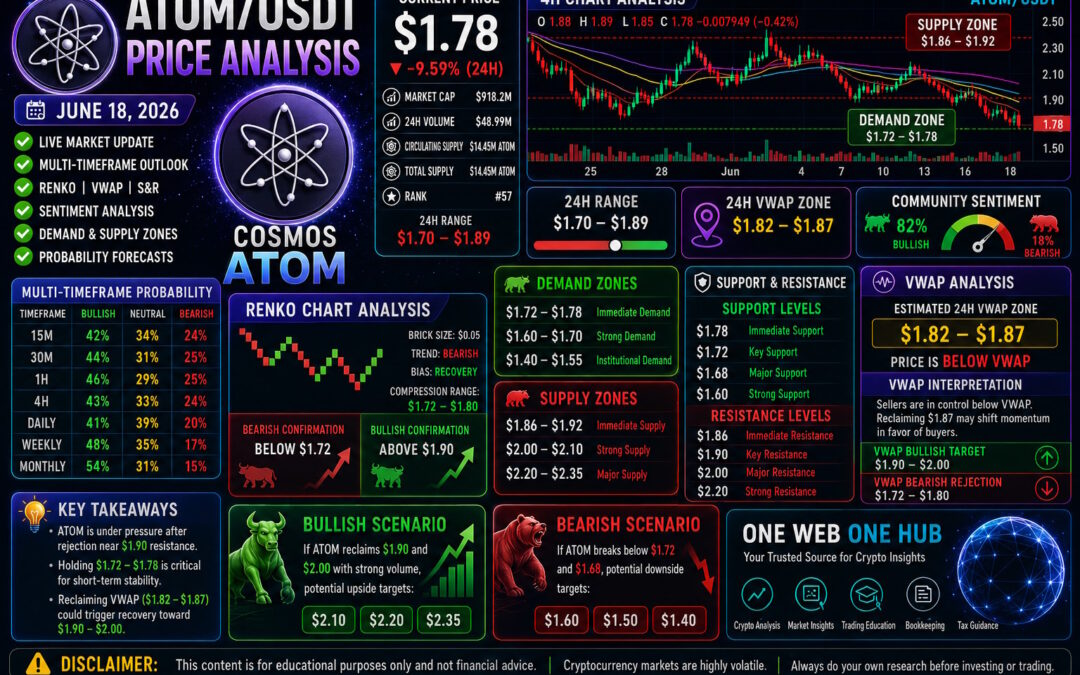
ATOM/USDT is currently trading around $1.78, experiencing renewed selling pressure after another rejection from the $1.90 resistance region. Based on current market structure visible on TradingView and CoinMarketCap, buyers are attempting to defend the $1.75–$1.78 support zone while overall momentum remains cautiously bearish.
Despite today’s decline, community sentiment remains overwhelmingly optimistic, suggesting long-term investors continue accumulating during weakness while short-term traders remain defensive.
Live Market Snapshot
Current Statistics
Price
-
Current Price: ~$1.78
Market Capitalization
-
Approximately $918 Million
24-Hour Change
-
-9.59%
24-Hour Volume
-
Approximately $48.99 Million
Community Sentiment
-
82% Bullish
-
18% Bearish
Overall Market Structure
Short-Term Trend
Bearish
Medium-Term Trend
Neutral to Bearish
Long-Term Trend
Accumulation Phase
Multi-Timeframe Probability Analysis
15-Minute Analysis
Market Structure
Short-term selling pressure remains active after rejection near intraday highs.
Probability
-
Bullish Recovery: 42%
-
Sideways Consolidation: 34%
-
Bearish Continuation: 24%
Expected Range
$1.76 – $1.84
30-Minute Analysis
Market Structure
Momentum indicators suggest sellers still control short-term price action.
Probability
-
Bullish Recovery: 44%
-
Sideways Movement: 31%
-
Bearish Breakdown: 25%
Expected Range
$1.75 – $1.87
1-Hour Analysis
Market Structure
Price remains below major moving averages while attempting stabilization.
Probability
-
Recovery toward $1.90: 46%
-
Consolidation: 29%
-
Decline toward $1.70: 25%
Expected Range
$1.72 – $1.90
4-Hour Analysis
Market Structure
The 4H chart remains inside a corrective phase following the previous breakdown.
Probability
-
Bullish Recovery: 43%
-
Sideways Accumulation: 33%
-
Bearish Continuation: 24%
Expected Range
$1.68 – $1.95
Daily Analysis
Market Structure
Daily candles continue building a possible accumulation base following recent weakness.
Probability
-
Bullish Recovery: 41%
-
Accumulation Phase: 39%
-
Bearish Continuation: 20%
Expected Range
$1.60 – $2.10
Weekly Analysis
Market Structure
Weekly structure continues showing long-term accumulation despite persistent volatility.
Probability
-
Long-Term Recovery: 48%
-
Sideways Base Formation: 35%
-
Continued Decline: 17%
Expected Range
$1.40 – $2.50
Monthly Analysis
Market Structure
ATOM remains significantly below previous cycle highs, indicating long-term value accumulation for patient investors.
Probability
-
Bullish Macro Recovery: 54%
-
Long-Term Consolidation: 31%
-
Bearish Continuation: 15%
Expected Range
$1.20 – $4.20
Renko Chart Analysis
Current Renko Trend
Bearish Recovery Attempt
Estimated Brick Size
$0.05
Renko Trend Interpretation
Recent bearish Renko bricks continue dominating, although momentum is slowing near the $1.75 support area. A bullish reversal requires confirmation through multiple consecutive green bricks above resistance.
Bullish Confirmation
Above $1.90
Bearish Confirmation
Below $1.72
Renko Price Targets
Bullish
-
$1.95
-
$2.05
-
$2.20
Bearish
-
$1.70
-
$1.60
-
$1.50
Demand Zones
Immediate Demand
$1.72 – $1.78
Strong Demand
$1.60 – $1.70
Institutional Demand
$1.40 – $1.55
These regions have historically attracted increased buying interest and could serve as accumulation areas if broader market conditions stabilize.
Supply Zones
Immediate Supply
$1.86 – $1.92
Strong Supply
$2.00 – $2.10
Major Supply
$2.20 – $2.35
These levels have consistently produced seller activity and will likely require strong volume to overcome.
Support Levels
Immediate Support
-
$1.78
-
$1.72
-
$1.68
Major Support
-
$1.60
-
$1.50
Resistance Levels
Immediate Resistance
-
$1.86
-
$1.90
Major Resistance
-
$2.00
-
$2.10
-
$2.20
VWAP Analysis
Estimated 24H VWAP Zone
Without direct access to the live VWAP indicator, the zone is estimated using intraday price distribution, trading volume concentration, and average market participation.
Estimated VWAP Range
$1.82 – $1.87
Interpretation
Current price is trading below the estimated 24-hour VWAP, indicating that short-term sellers remain in control.
A sustained recovery above the VWAP would improve bullish momentum and could trigger renewed buying interest.
VWAP Bullish Target
$1.90 – $2.00
VWAP Bearish Rejection Zone
$1.72 – $1.80
Sentiment Analysis
Current Market Sentiment
Community voting continues to favor the bullish side despite today’s decline.
Bullish
82%
Bearish
18%
Sentiment Price Zones
Bullish Zone
Above $1.90
Neutral Zone
$1.78 – $1.90
Bearish Zone
Below $1.72
Behavioral Analysis
Retail investors continue viewing current prices as long-term accumulation opportunities, while professional traders remain cautious until resistance levels are reclaimed.
Basis of Probability Analysis
Methodology
The probability estimates are derived using multiple technical and behavioral factors, including:
-
Multi-timeframe trend alignment
-
Support and resistance confluence
-
Estimated VWAP positioning
-
Renko brick direction
-
RSI and Stochastic momentum
-
Bollinger Band expansion and contraction
-
Historical price reactions
-
Volume profile observations
-
Market sentiment indicators
-
Liquidity zones and market structure analysis
These probabilities represent analytical scenarios rather than guarantees and are intended solely for educational purposes.
Final Outlook
Bullish Scenario
If buyers reclaim:
-
$1.90
-
$2.00
Potential upside targets include:
-
$2.10
-
$2.20
-
$2.35
Bearish Scenario
If support fails below:
-
$1.72
-
$1.68
Potential downside targets become:
-
$1.60
-
$1.50
-
$1.40
Overall, ATOM remains at an important technical inflection point. Confirmation above resistance could improve the medium-term outlook, while a break below current support would strengthen bearish momentum.
Educational Disclaimer
This article is provided solely for educational and informational purposes. It does not constitute financial, investment, or trading advice. Cryptocurrency markets are highly volatile and involve significant risk. Always perform your own research and consult a licensed financial advisor before making investment decisions.
Continue Learning with One Web One Hub
18 Jun 2026 ATOMUSDT (Referral Link)
Your Trusted Destination for Crypto Education
One Web One Hub publishes in-depth educational content covering cryptocurrency markets, technical analysis, bookkeeping, taxation, investing, and financial literacy.
What You’ll Discover
-
Daily cryptocurrency market analysis
-
Renko and VWAP educational guides
-
Multi-timeframe technical outlooks
-
Support and resistance mapping
-
Market sentiment analysis
-
Accounting and bookkeeping resources
-
Tax planning and compliance articles
-
Practical financial education for traders and investors
Join Our Growing Community
Whether you’re a beginner or an experienced trader, One Web One Hub is designed to help you better understand market behavior through data-driven, educational content. Visit regularly for fresh insights, actionable learning resources, and comprehensive market analysis to support your financial journey.
Previous Post ATOMUSDT – Probability Analysis for Jun 09, 2026


