SOLUSDT – Probability Analysis For Jun 16, 2026
SOLUSDT Price Probability Analysis for June 16, 2026
Live Market Overview
According to the latest TradingView and CoinMarketCap market data visible at the time of analysis:
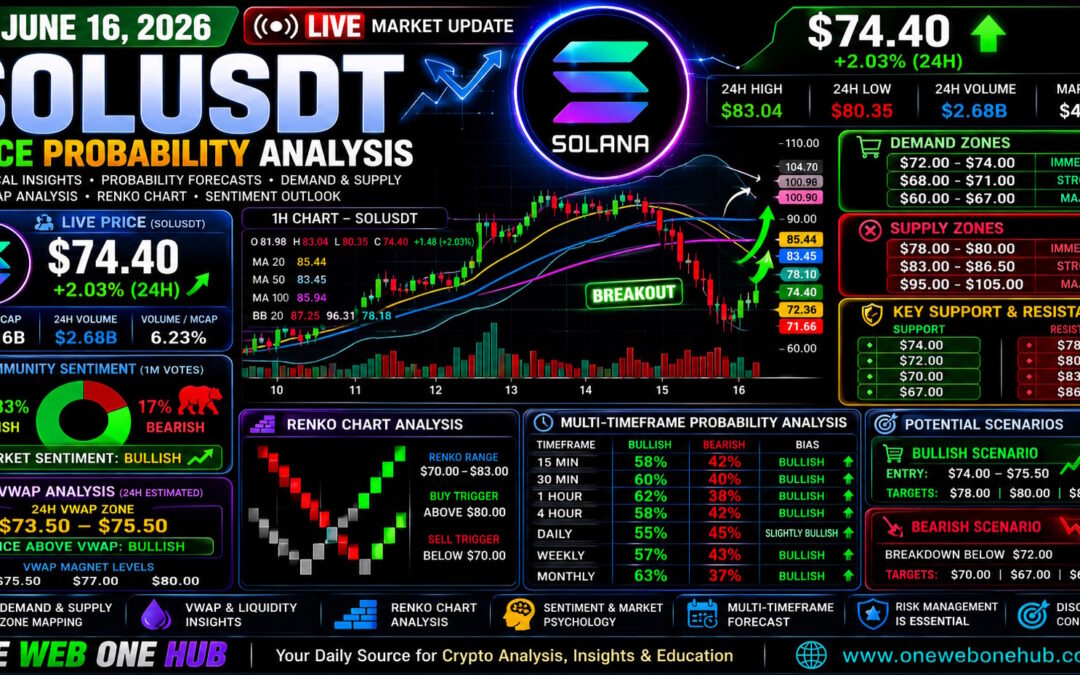
- Current SOLUSDT Price: $74.40
- 24-Hour Change: +2.03%
- 24-Hour High: $83.04
- 24-Hour Low: $80.35
- Market Capitalization: Approximately $43.16 Billion
- 24-Hour Volume: Approximately $2.68 Billion
- Volume-to-Market Cap Ratio: 6.23%
After the sharp correction witnessed during the first half of June, Solana is showing signs of stabilization and recovery. Buyers have successfully defended the recent lows near $60–$65, resulting in a short-term bullish rebound.
Market Structure Analysis
Current Market Trend
SOLUSDT remains in a broader corrective structure but has begun forming a potential recovery pattern.
Current observations include:
- Higher lows developing on lower timeframes
- Strong bounce from oversold conditions
- Volume recovery supporting recent upside
- Stochastic RSI entering bullish territory
- Price attempting to reclaim short-term moving averages
The market has transitioned from panic selling into a recovery phase.
Probability Analysis Methodology
Factors Used for Probability Calculations
The probability estimates are based on:
- Multi-timeframe trend alignment
- Historical volatility patterns
- Support and resistance interactions
- Demand and supply zones
- RSI and Stochastic RSI momentum
- Bollinger Band positioning
- Estimated VWAP location
- Trading volume behavior
- Market sentiment indicators
- Liquidity and order-flow analysis
Probabilities represent weighted market scenarios rather than certainties.
Demand Zone Analysis
Immediate Demand Zone
$72.00 – $74.00
Current buyers appear highly active within this region.
Strong Demand Zone
$68.00 – $71.00
Likely accumulation zone if short-term support breaks.
Major Demand Zone
$60.00 – $67.00
Institutional accumulation region from recent capitulation.
Supply Zone Analysis
Immediate Supply Zone
$78.00 – $80.00
First significant resistance area.
Strong Supply Zone
$83.00 – $86.50
Major moving average and previous breakdown region.
Macro Supply Zone
$95.00 – $105.00
Long-term institutional supply zone.
Key Support and Resistance Levels
Major Support Levels
- $74.00
- $72.00
- $70.00
- $67.00
Major Resistance Levels
- $78.00
- $80.00
- $83.50
- $86.50
15-Minute Timeframe Probability Analysis
Bullish Probability: 58%
Momentum remains favorable.
Targets:
- $75.50
- $77.00
Bearish Probability: 42%
Short-term pullback possibility.
Targets:
- $73.00
- $72.00
Bias
Moderately Bullish
30-Minute Timeframe Probability Analysis
Bullish Probability: 60%
Recent recovery structure remains intact.
Targets:
- $77.00
- $78.50
Bearish Probability: 40%
Profit-taking pressure.
Targets:
- $72.50
- $71.00
1-Hour Timeframe Probability Analysis
Bullish Probability: 62%
Buyers continue regaining control.
Targets:
- $78.50
- $80.00
Bearish Probability: 38%
Failure to hold support.
Targets:
- $71.00
- $69.00
4-Hour Timeframe Probability Analysis
Bullish Probability: 58%
Recovery trend developing.
Targets:
- $80.00
- $83.50
Bearish Probability: 42%
Rejection from resistance.
Targets:
- $70.00
- $68.00
Daily Timeframe Probability Analysis
Bullish Probability: 55%
Recovery phase gaining traction.
Targets:
- $86.00
- $92.00
Bearish Probability: 45%
Macro correction remains possible.
Targets:
- $68.00
- $65.00
Weekly Timeframe Probability Analysis
Bullish Probability: 57%
Long-term ecosystem strength remains supportive.
Targets:
- $95.00
- $110.00
Bearish Probability: 43%
Broader crypto weakness returns.
Targets:
- $60.00
- $55.00
Monthly Timeframe Probability Analysis
Bullish Probability: 63%
Long-term outlook remains constructive.
Targets:
- $120.00
- $150.00
Bearish Probability: 37%
Extended crypto risk-off environment.
Targets:
- $55.00
- $50.00
Renko Chart Analysis
Current Renko Structure
The Renko structure shows:
- Bullish reversal bricks emerging
- Previous bearish momentum weakening
- Early-stage trend recovery confirmation
Renko Support Range
$70.00 – $73.00
Renko Resistance Range
$78.00 – $83.00
Renko Buy Trigger
Above $80.00
Targets:
- $86.00
- $92.00
Renko Sell Trigger
Below $70.00
Targets:
- $67.00
- $63.00
24-Hour VWAP Analysis
Estimated VWAP Zone
Without direct VWAP indicator access, volume distribution suggests:
- 24H VWAP Zone: $73.50 – $75.50
Current Position Relative to VWAP
Current price is trading within the estimated VWAP zone.
This indicates:
- Neutral-to-bullish sentiment
- Balanced buyer and seller participation
- Potential continuation if price remains above $74
VWAP Magnet Levels
First Magnet
$75.50
Second Magnet
$77.00
Third Magnet
$80.00
Sentiment Analysis
Retail Sentiment
Retail sentiment has improved significantly following the recovery from June lows.
Smart Money Sentiment
Institutional participants appear to be accumulating positions after the recent correction.
Derivatives Sentiment
Current indicators suggest:
- Reduced liquidation pressure
- Improving market confidence
- Moderate bullish positioning
Sentiment Price Zones
Bullish Sentiment Zone
Above $76.00
Neutral Sentiment Zone
$72.00 – $76.00
Bearish Sentiment Zone
Below $72.00
Alternative Market Insights
There are no reliable or verifiable “dark web insights” capable of forecasting cryptocurrency prices.
However, alternative market observations currently indicate:
- Recovery from capitulation conditions
- Declining sell pressure
- Improving accumulation signals
- Stabilizing liquidity conditions
These factors support the possibility of continued short-term recovery.
Trading Scenarios
Bullish Scenario
Entry Region:
$74.00 – $75.00
Targets:
- $78.00
- $80.00
- $83.50
Bearish Scenario
Breakdown Below:
$72.00
Targets:
- $70.00
- $67.00
- $65.00
Final SOLUSDT Outlook for June 16, 2026
SOLUSDT has successfully stabilized after a significant correction and is showing encouraging signs of recovery. While the broader market remains cautious, short-term momentum now favors buyers.
Highest Probability Scenario
- Trading range between $72.00 and $80.00
- Gradual recovery toward resistance zones
- Increased volatility near $80.00 resistance
The key level to monitor remains $80.00. A successful breakout above this region could open the door toward $86–$92 in the coming weeks.
Educational Disclaimer
This article is intended solely for educational and informational purposes and should not be considered financial advice, investment advice, or trading recommendations. Cryptocurrency markets are highly volatile and involve significant risk. Always perform your own independent research and consult a qualified financial professional before making investment decisions.
Why Traders Visit One Web One Hub Daily
16 Jun 2026 SOLUSDT FI (Referral Link)
Professional Crypto Analysis Made Simple
One Web One Hub transforms complex market data into practical educational insights designed for traders, investors, and crypto enthusiasts.
What You’ll Discover
- Daily cryptocurrency forecasts
- Multi-timeframe probability analysis
- Renko and VWAP market studies
- Demand and supply zone mapping
- Sentiment and liquidity insights
- Educational trading content
Stay Ahead of the Market
Whether you are a beginner seeking clarity or an experienced trader looking for additional market perspectives, One Web One Hub delivers structured, data-driven analysis designed to help you navigate every phase of the cryptocurrency market.
Bookmark One Web One Hub today and return daily for fresh market intelligence, educational resources, and professional crypto analysis.
Previous Post SOLUSDT – Probability Analysis For Jun 10, 2026


