ETHUSDT – Probability Analysis for Jun 06, 2026
ETHUSDT Price Analysis – June 06, 2026
Current ETHUSDT Live Price
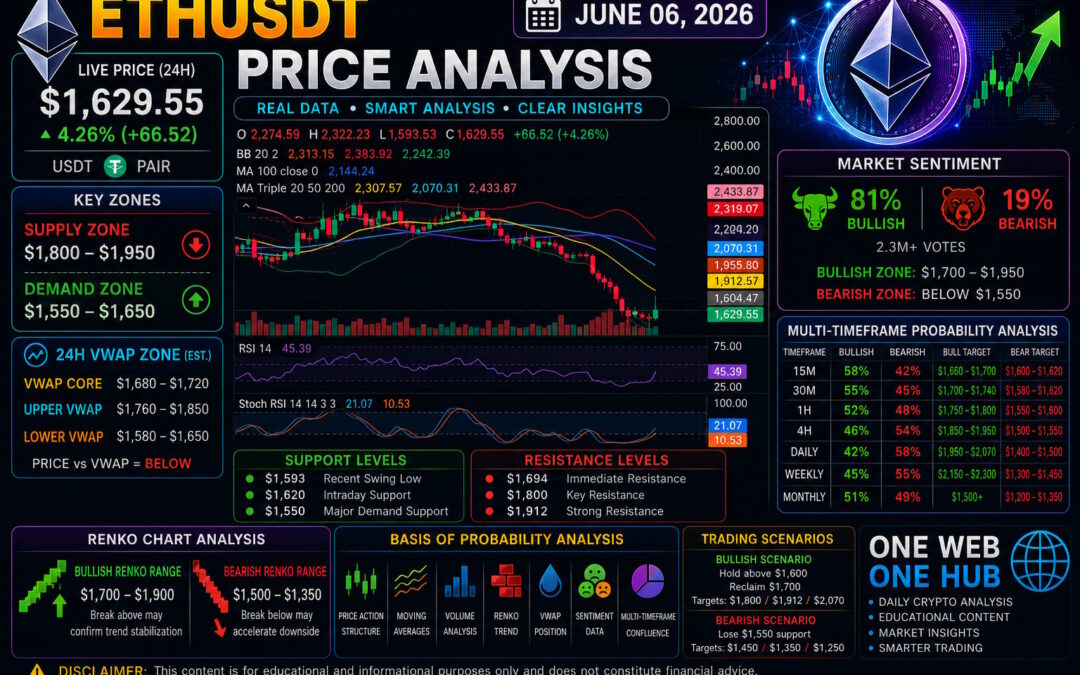
Ethereum (ETHUSDT) is trading near $1,629.55 based on the latest market snapshot provided. Despite a 24-hour gain of approximately 4.26%, Ethereum remains under significant bearish pressure after a sharp decline from the $2,300 region.
The current market environment reflects a high-volatility recovery attempt following a major liquidation event that pushed ETH into a critical long-term demand zone.
Market Overview
What Happened to Ethereum?
Ethereum recently experienced a strong selloff that broke several major support levels:
- $2,150 support failed
- $1,950 support failed
- $1,800 support failed
- Price temporarily reached the $1,600 demand area
The current bounce appears to be a relief rally rather than a confirmed trend reversal.
Market Structure
Current structure remains:
- Long-term bearish
- Short-term oversold
- Recovery attempt underway
- High volatility environment
Key Support and Resistance Levels
Immediate Support
$1,593 – Recent swing low
$1,620 – Intraday support
$1,550 – Major demand support
Strong Support Zone
$1,500 – $1,600
This remains the most important institutional accumulation zone visible on the chart.
Immediate Resistance
$1,694
$1,800
$1,912
Major Resistance
$1,955
$2,070
$2,144
Macro Resistance
$2,274 – $2,435
Demand and Supply Zones
Primary Demand Zone
$1,550 – $1,650
Strong buyer activity is expected within this region.
Secondary Demand Zone
$1,450 – $1,550
Institutional accumulation area.
Extreme Demand Zone
$1,300 – $1,450
Long-term defensive support.
Primary Supply Zone
$1,800 – $1,950
First major seller concentration area.
Secondary Supply Zone
$2,000 – $2,150
Recovery sellers likely active.
Macro Supply Zone
$2,250 – $2,450
Major long-term resistance cluster.
Estimated 24H VWAP Analysis
Estimated 24H VWAP Core Zone
$1,680 – $1,720
Upper VWAP Deviation
$1,760 – $1,850
Lower VWAP Deviation
$1,580 – $1,650
VWAP Interpretation
Current price remains below the estimated 24-hour VWAP equilibrium.
This indicates:
- Sellers still control broader trend direction
- Recovery attempts face resistance near VWAP
- Reclaiming VWAP would strengthen bullish momentum
Current VWAP bias remains bearish despite the bounce.
Renko Chart Analysis
Current Renko Structure
Renko charts continue showing a dominant bearish trend.
Several consecutive bearish bricks formed during the recent selloff before a small bullish recovery brick appeared near $1,600.
Bullish Renko Range
$1,700 – $1,900
Break above this range could confirm trend stabilization.
Bearish Renko Range
$1,500 – $1,350
Failure to hold $1,550 could accelerate downside pressure.
Renko Trend Bias
Bearish with oversold recovery conditions.
Multi-Timeframe Probability Analysis
15-Minute Timeframe
Bullish Probability: 58%
Target Range: $1,660 – $1,700
Bearish Probability: 42%
Target Range: $1,600 – $1,620
30-Minute Timeframe
Bullish Probability: 55%
Target Range: $1,700 – $1,740
Bearish Probability: 45%
Target Range: $1,580 – $1,620
1-Hour Timeframe
Bullish Probability: 52%
Target Range: $1,750 – $1,800
Bearish Probability: 48%
Target Range: $1,550 – $1,600
4-Hour Timeframe
Bullish Probability: 46%
Target Range: $1,850 – $1,950
Bearish Probability: 54%
Target Range: $1,500 – $1,550
Daily Timeframe
Bullish Probability: 42%
Target Range: $1,950 – $2,070
Bearish Probability: 58%
Target Range: $1,400 – $1,500
Weekly Timeframe
Bullish Probability: 45%
Target Range: $2,150 – $2,300
Bearish Probability: 55%
Target Range: $1,300 – $1,450
Monthly Timeframe
Bullish Probability: 51%
Target Range: $2,500+
Bearish Probability: 49%
Target Range: $1,200 – $1,350
The monthly structure remains neutral as ETH approaches historically important accumulation zones.
Market Sentiment Analysis
Community Sentiment
Current sentiment remains:
Bullish: 81%
Bearish: 19%
Sentiment Price Ranges
Bullish Recovery Zone
$1,700 – $1,950
Neutral Zone
$1,600 – $1,700
Bearish Continuation Zone
Below $1,550
Sentiment Interpretation
Retail traders remain highly optimistic despite the sharp decline. Historically, extreme bullish sentiment during major corrections often precedes elevated volatility.
Basis of Probability Analysis
Factors Used
- Price action structure
- Support and resistance zones
- Bollinger Bands
- Moving averages
- Renko trend analysis
- Estimated VWAP positioning
- Market sentiment
- Volume behavior
- Multi-timeframe confluence
These probabilities represent scenario analysis and not guaranteed outcomes.
Trading Outlook for June 2026
Bullish Scenario
Conditions:
- Hold above $1,600
- Reclaim $1,700
- Break above VWAP
Targets:
$1,800
$1,912
$2,070
Bearish Scenario
Conditions:
- Lose $1,550 support
Targets:
$1,450
$1,350
$1,250
Risk Management Considerations
Current volatility remains extremely elevated.
Traders should:
- Reduce leverage exposure
- Scale into positions gradually
- Use stop-loss protection
- Avoid emotional trading decisions
- Focus on risk-to-reward ratios
Preservation of capital remains the primary objective during high-volatility environments.
Educational Disclaimer
This content is for educational and informational purposes only and should not be considered financial, investment, or trading advice.
Cryptocurrency markets are highly volatile and involve substantial risk. Always conduct your own independent research and consult a qualified financial advisor before making investment decisions.
One Web One Hub – Your Daily Crypto Market Intelligence Hub
06 Jun 2026 ETHUSDT FI (Referral Link)
Why Readers Follow One Web One Hub
- Daily ETH and BTC market analysis
- Probability-based trading scenarios
- Renko and VWAP educational insights
- Support and resistance mapping
- Crypto market sentiment tracking
- Risk management education
- Multi-timeframe forecasting
Stay Ahead of Market Trends
Successful traders focus on probabilities, risk management, and market structure rather than emotions.
At One Web One Hub, our mission is to provide educational cryptocurrency content that helps traders understand market behavior, identify opportunities, and build long-term trading discipline.
Whether markets are bullish, bearish, or uncertain, One Web One Hub helps you stay informed, prepared, and one step ahead of the crowd.
One Web. One Hub. One Smarter Trading Journey.
Previous Post ETHUSDT – Probability Analysis for May 30, 2026


