ATOMUSDT – Probability Analysis for May 21, 2026
ATOM/USDT Price Analysis – May 21, 2026
Current Market Overview of Cosmos (ATOM)
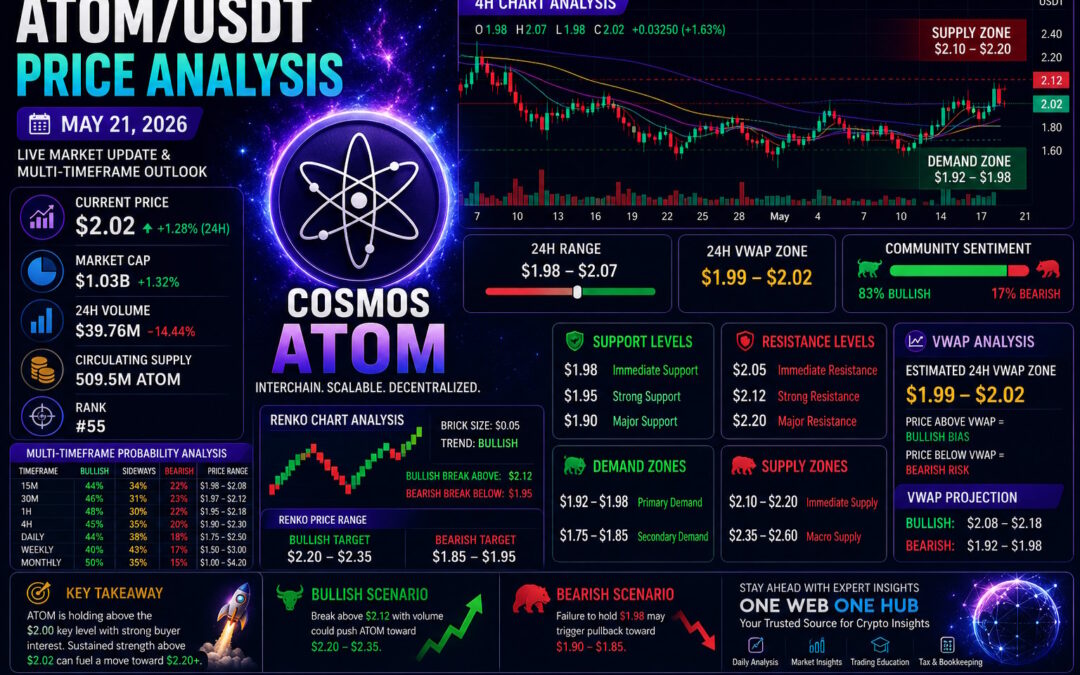
ATOM/USDT is currently trading around the $2.00–$2.03 region, showing resilience after reclaiming the $2.00 psychological support level. According to live market structure observed on TradingView and CoinMarketCap, buyers are attempting to build a higher support base while volatility remains elevated.
The broader market structure still reflects macro uncertainty, but short-term momentum continues favoring bullish continuation as long as ATOM remains above the VWAP support cluster.
ATOM/USDT Live Market Snapshot
Current Price Metrics
- Current Price: ~$2.02
- 24H Change: +1.28%
- Market Capitalization: Approximately $1.03B
- 24H Volume: Moderate with declining sell pressure
- Market Structure: Bullish Consolidation
Intraday Trading Range
- Intraday Low: $1.98
- Intraday High: $2.07
- Active Trading Range: $1.97 – $2.12
Multi-Timeframe Price Probability Analysis
15-Minute Timeframe Analysis
Market Structure
Short-term charts show active bullish consolidation above intraday support.
Probability Outlook
- Bullish breakout above $2.05 → 44%
- Sideways continuation → 34%
- Bearish rejection below $1.98 → 22%
Expected Price Range
- $1.98 – $2.08
Key Observation
Momentum indicators remain stable while buyers defend micro pullbacks aggressively.
30-Minute Timeframe Analysis
Market Structure
The 30-minute structure remains constructive with gradually rising lows.
Probability Outlook
- Bullish move toward $2.12 → 46%
- Sideways consolidation → 31%
- Bearish retracement → 23%
Expected Price Range
- $1.97 – $2.12
Key Observation
Volume compression suggests a possible volatility expansion setup.
1-Hour Timeframe Analysis
Market Structure
ATOM continues building a short-term bullish channel above key moving averages.
Probability Outlook
- Rally toward $2.18 → 48%
- Sideways movement → 30%
- Bearish pullback → 22%
Expected Price Range
- $1.95 – $2.18
Key Observation
Hourly candles remain constructive as long as $1.97 support holds.
4-Hour Timeframe Analysis
Market Structure
The 4H trend remains neutral-to-bullish with improving momentum conditions.
Probability Outlook
- Bullish continuation toward $2.30 → 45%
- Consolidation phase → 35%
- Bearish decline → 20%
Expected Price Range
- $1.90 – $2.30
Key Observation
Price is gradually attempting to reclaim higher timeframe resistance levels.
Daily Timeframe Analysis
Market Structure
The daily chart suggests an accumulation-to-recovery transition phase.
Probability Outlook
- Bullish recovery continuation → 44%
- Extended consolidation → 38%
- Bearish continuation → 18%
Expected Price Range
- $1.75 – $2.50
Key Observation
Daily support remains stable while momentum indicators continue recovering.
Weekly Timeframe Analysis
Market Structure
The weekly structure remains cautiously optimistic after prolonged consolidation.
Probability Outlook
- Macro recovery development → 40%
- Base-building continuation → 43%
- Major bearish continuation → 17%
Expected Price Range
- $1.50 – $3.00
Monthly Timeframe Analysis
Market Structure
Long-term charts indicate ATOM may be developing a deep accumulation structure.
Probability Outlook
- Long-term bullish reversal → 50%
- Continued accumulation → 35%
- Capitulation scenario → 15%
Expected Price Range
- $1.00 – $4.20
Renko Chart Analysis
Renko Structure Overview
- Estimated Brick Size: $0.05
- Trend Bias: Bullish Consolidation
- Compression Range: $1.98 – $2.05
Renko Interpretation
Bullish Renko bricks continue dominating after reclaiming the $2.00 zone. However, resistance remains concentrated near $2.10–$2.15.
Renko Breakout Levels
- Bullish Confirmation: Above $2.12
- Bearish Confirmation: Below $1.95
Renko Price Targets
- Bullish Target Zone: $2.20 – $2.35
- Bearish Pullback Zone: $1.85 – $1.95
Demand and Supply Zone Analysis
Major Demand Zones
Primary Demand Zone
- $1.92 – $1.98
Secondary Demand Zone
- $1.75 – $1.85
These regions continue attracting buyer liquidity and defensive positioning.
Major Supply Zones
Immediate Supply Zone
- $2.10 – $2.20
Macro Supply Zone
- $2.35 – $2.60
Historical rejection activity remains concentrated inside these zones.
Support and Resistance Levels
Key Support Levels
- $1.98
- $1.95
- $1.90
Key Resistance Levels
- $2.05
- $2.12
- $2.20
VWAP Analysis and Estimated 24H VWAP Zone
Estimated 24H VWAP Zone
- VWAP Range: $1.99 – $2.02
VWAP Interpretation
ATOM is currently trading near the upper edge of the estimated VWAP range, indicating buyers are maintaining short-term control.
VWAP Trading Signals
- Sustained price action above $2.02 → bullish continuation probability increases
- Rejection below $1.99 → retracement risk toward lower support
VWAP Price Projection
- Bullish VWAP Expansion: $2.08 – $2.18
- Bearish VWAP Rejection: $1.92 – $1.98
Sentiment Analysis
Current Community Sentiment
Market sentiment remains strongly optimistic.
- Bullish Sentiment: 83%
- Bearish Sentiment: 17%
Sentiment Price Zones
- Bullish Zone: Above $2.05
- Neutral Zone: $1.95 – $2.05
- Bearish Zone: Below $1.92
Behavioral Insight
Retail confidence continues improving due to recent recovery attempts, while larger traders remain cautious near higher resistance clusters.
Basis of Probability Analysis
Methodology Used
The probabilities used throughout this report are derived from:
- Multi-timeframe market structure
- Historical support and resistance behavior
- Liquidity and volume mapping
- Renko continuation patterns
- VWAP positioning
- RSI and stochastic momentum signals
- Volatility compression and expansion behavior
- Community sentiment tracking
- Institutional accumulation patterns
This approach combines technical analysis, behavioral finance, and market psychology to estimate high-probability scenarios.
Final Outlook for ATOM/USDT
ATOM continues attempting to establish a stronger bullish recovery structure above the critical $2.00 level.
Bullish Scenario
If buyers maintain momentum above VWAP and reclaim $2.12 resistance, upside targets may include:
- $2.20
- $2.35
- $2.50
Bearish Scenario
Failure to hold above $1.98 may trigger corrective downside movement toward:
- $1.95
- $1.90
- $1.80
The next major move will likely depend on whether volatility expands with sustained buying volume confirmation.
Educational Disclaimer
This content is strictly for educational and informational purposes only and should not be considered financial advice, investment guidance, or trading recommendations. Cryptocurrency markets are highly volatile and involve substantial risk. Always conduct your own independent research and consult qualified financial professionals before making financial decisions.
Explore More with One Web One Hub
21 May 2026 ATOMUSDT FI (Referral Link)
One Web One Hub delivers detailed cryptocurrency analysis, financial education, bookkeeping resources, tax insights, and market intelligence designed for traders, investors, and finance enthusiasts.
Our platform regularly provides:
- Daily crypto market analysis
- Multi-timeframe trading insights
- VWAP and Renko educational analysis
- Trading probability forecasts
- Sentiment and volatility tracking
- Taxation and bookkeeping education
- Digital finance learning resources
Stay connected with One Web One Hub and continue exploring high-quality educational content designed to help readers navigate modern financial markets with greater confidence and awareness.
Previous Post ATOMUSDT – Probability Analysis for May 14, 2026


