ATOMUSDT – Probability Analysis for May 14, 2026
ATOM/USDT Price Analysis – May 14, 2026
Current Market Overview of Cosmos (ATOM)
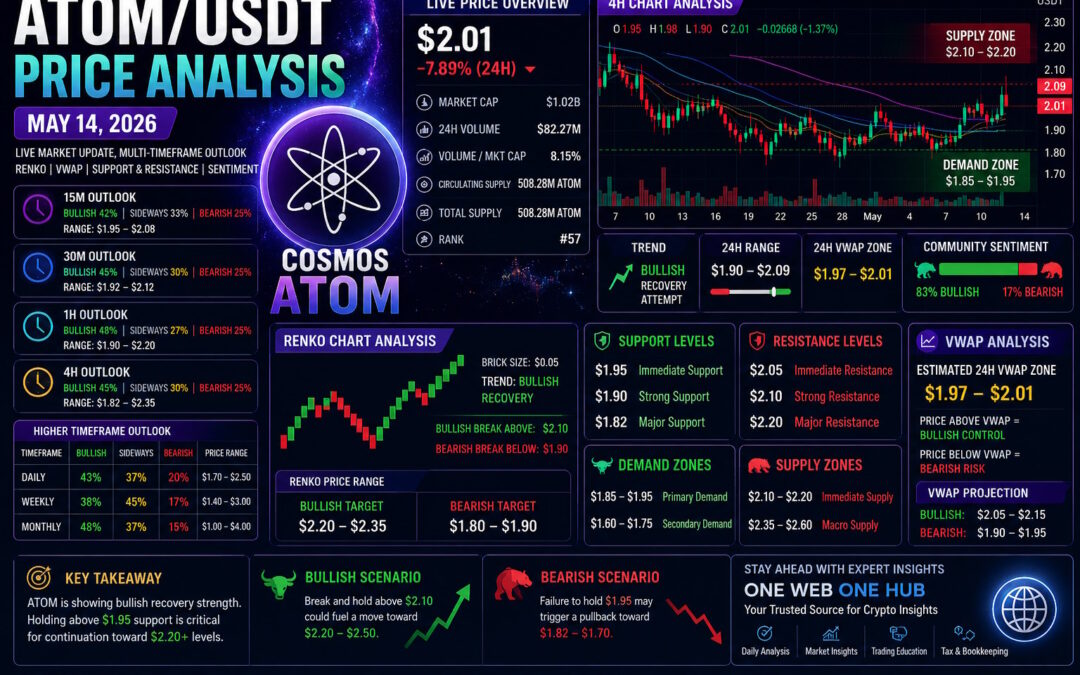
ATOM/USDT is currently trading around the $2.00–$2.02 zone, showing renewed bullish momentum after reclaiming the psychological $2.00 level. Recent market activity from TradingView and CoinMarketCap indicates increased volatility, rising speculative activity, and strengthening short-term market sentiment.
Despite the broader macro downtrend still remaining intact on higher timeframes, short-term traders are aggressively attempting to push ATOM into a new recovery phase.
ATOM/USDT Live Market Snapshot
Current Price Metrics
-
Current Price: ~$2.01
-
24H Change: -7.8%
-
Market Cap: Approximately $1.02B
-
24H Volume: Elevated volatility conditions
-
Market Structure: Bullish Recovery Attempt
Intraday Trading Range
-
Intraday Low: $1.90
-
Intraday High: $2.09
-
Active Trading Zone: $1.95 – $2.05
Multi-Timeframe Price Probability Analysis
15-Minute Timeframe Analysis
Market Structure
Short-term momentum remains volatile with rapid liquidity sweeps occurring near resistance.
Probability Outlook
-
Bullish continuation above $2.05 → 42%
-
Sideways consolidation → 33%
-
Bearish rejection below $1.95 → 25%
Expected Price Range
-
$1.95 – $2.08
Key Observation
Scalping momentum remains active while buyers defend the VWAP zone aggressively.
30-Minute Timeframe Analysis
Market Structure
The 30-minute chart shows a short-term recovery channel forming.
Probability Outlook
-
Bullish move toward $2.12 → 45%
-
Range-bound movement → 30%
-
Pullback toward $1.92 → 25%
Expected Price Range
-
$1.92 – $2.12
Key Observation
Higher lows continue forming, suggesting improving buyer confidence.
1-Hour Timeframe Analysis
Market Structure
ATOM is attempting to establish a bullish short-term structure above moving average support.
Probability Outlook
-
Rally toward $2.20 → 48%
-
Sideways consolidation → 27%
-
Bearish reversal → 25%
Expected Price Range
-
$1.90 – $2.20
Key Observation
The hourly structure remains constructive as long as price holds above $1.95.
4-Hour Timeframe Analysis
Market Structure
The broader 4H trend remains neutral-to-bullish after reclaiming multiple resistance zones.
Probability Outlook
-
Bullish expansion toward $2.35 → 45%
-
Consolidation near $2.00 → 30%
-
Bearish retracement → 25%
Expected Price Range
-
$1.82 – $2.35
Key Observation
Momentum indicators show strengthening trend conditions despite elevated volatility.
Daily Timeframe Analysis
Market Structure
The daily chart suggests early-stage accumulation transitioning into a recovery attempt.
Probability Outlook
-
Continued bullish recovery → 43%
-
Sideways macro accumulation → 37%
-
Bearish continuation → 20%
Expected Price Range
-
$1.70 – $2.50
Key Observation
Daily candles are attempting to break previous lower-high resistance.
Weekly Timeframe Analysis
Market Structure
The weekly trend remains structurally bearish but accumulation signs continue strengthening.
Probability Outlook
-
Macro reversal development → 38%
-
Extended base formation → 45%
-
Major bearish continuation → 17%
Expected Price Range
-
$1.40 – $3.00
Monthly Timeframe Analysis
Market Structure
Long-term charts suggest ATOM may be entering a deep accumulation phase after prolonged downside pressure.
Probability Outlook
-
Long-term bullish reversal → 48%
-
Continued accumulation → 37%
-
Capitulation scenario → 15%
Expected Price Range
-
$1.00 – $4.00
Renko Chart Analysis
Renko Structure Overview
-
Estimated Brick Size: $0.05
-
Trend Bias: Bullish Recovery
-
Renko Compression Range: $1.95 – $2.05
Renko Interpretation
Recent bullish Renko bricks confirm strong momentum after reclaiming the $1.95 zone. However, resistance remains active near $2.10–$2.20.
Renko Breakout Levels
-
Bullish Confirmation: Above $2.10
-
Bearish Confirmation: Below $1.90
Renko Price Targets
-
Bullish Target Zone: $2.20 – $2.35
-
Bearish Pullback Zone: $1.80 – $1.90
Demand and Supply Zone Analysis
Major Demand Zones
Primary Demand Area
-
$1.85 – $1.95
Secondary Demand Area
-
$1.60 – $1.75
These zones previously showed strong liquidity absorption and buyer interest.
Major Supply Zones
Immediate Supply Zone
-
$2.10 – $2.20
Macro Supply Zone
-
$2.35 – $2.60
Strong historical rejection zones remain concentrated here.
Support and Resistance Levels
Key Support Levels
-
$1.95
-
$1.90
-
$1.82
Key Resistance Levels
-
$2.05
-
$2.10
-
$2.20
VWAP Analysis and Estimated 24H VWAP Zone
Estimated 24H VWAP Zone
-
VWAP Range: $1.97 – $2.01
VWAP Interpretation
ATOM is trading slightly above the estimated 24H VWAP zone, indicating short-term bullish control.
VWAP Trading Signals
-
Sustained holding above $2.01 → bullish continuation
-
Rejection below $1.97 → bearish retracement risk
VWAP Price Projection
-
Bullish VWAP Expansion: $2.05 – $2.15
-
Bearish VWAP Rejection: $1.90 – $1.95
Sentiment Analysis
Current Community Sentiment
Recent sentiment data remains highly optimistic despite volatility.
-
Bullish Sentiment: 83%
-
Bearish Sentiment: 17%
Sentiment Price Zones
-
Bullish Zone: Above $2.05
-
Neutral Zone: $1.92 – $2.05
-
Bearish Zone: Below $1.90
Behavioral Insight
Retail traders appear increasingly confident in a recovery phase, while larger market participants continue monitoring liquidity reactions near major resistance.
Basis of Probability Analysis
Methodology Used
The probabilities in this report are based on:
-
Multi-timeframe technical structure
-
Volume behavior and liquidity mapping
-
Historical support and resistance reactions
-
VWAP positioning analysis
-
Renko chart trend continuation
-
RSI and stochastic momentum analysis
-
Volatility expansion behavior
-
Market sentiment tracking
-
Institutional liquidity zones
This hybrid approach combines technical analysis, behavioral finance, and market psychology modeling.
Final Outlook for ATOM/USDT
ATOM is entering a highly important technical zone after reclaiming the $2.00 psychological level.
Bullish Scenario
If buyers maintain control above the VWAP zone and reclaim $2.10 resistance, potential upside targets include:
-
$2.20
-
$2.35
-
$2.50
Bearish Scenario
Failure to hold above $1.95 may trigger another corrective move toward:
-
$1.90
-
$1.82
-
$1.70
The next major directional move will likely depend on volatility expansion and sustained volume confirmation.
Educational Disclaimer
This content is strictly for educational and informational purposes only and should not be interpreted as financial advice, investment recommendations, or trading instructions. Cryptocurrency markets are highly volatile and involve substantial risk. Always perform your own research and consult qualified financial professionals before making investment decisions.
Explore More with One Web One Hub
14 May 2026 ATOMUSDT FI (Referral Link)
One Web One Hub continues to provide detailed crypto analysis, trading education, financial insights, bookkeeping resources, taxation content, and market intelligence designed for modern digital investors and traders.
Our platform helps readers stay informed with:
-
Daily cryptocurrency analysis
-
Multi-timeframe trading insights
-
Renko and VWAP educational guides
-
Market sentiment tracking
-
Crypto trading probability forecasts
-
Tax and bookkeeping education
-
Financial growth resources
Stay connected with One Web One Hub and explore regularly updated educational content built to help traders and investors navigate fast-moving digital markets with confidence and discipline.
Previous Post ATOMUSDT – Probability Analysis for May 07, 2026
Next Post ATOMUSDT – Probability Analysis for May 21, 2026


