ETHUSDT – Probability Analysis for May 09, 2026
ETHUSDT Price Analysis – May 09, 2026
Current ETHUSDT Live Price
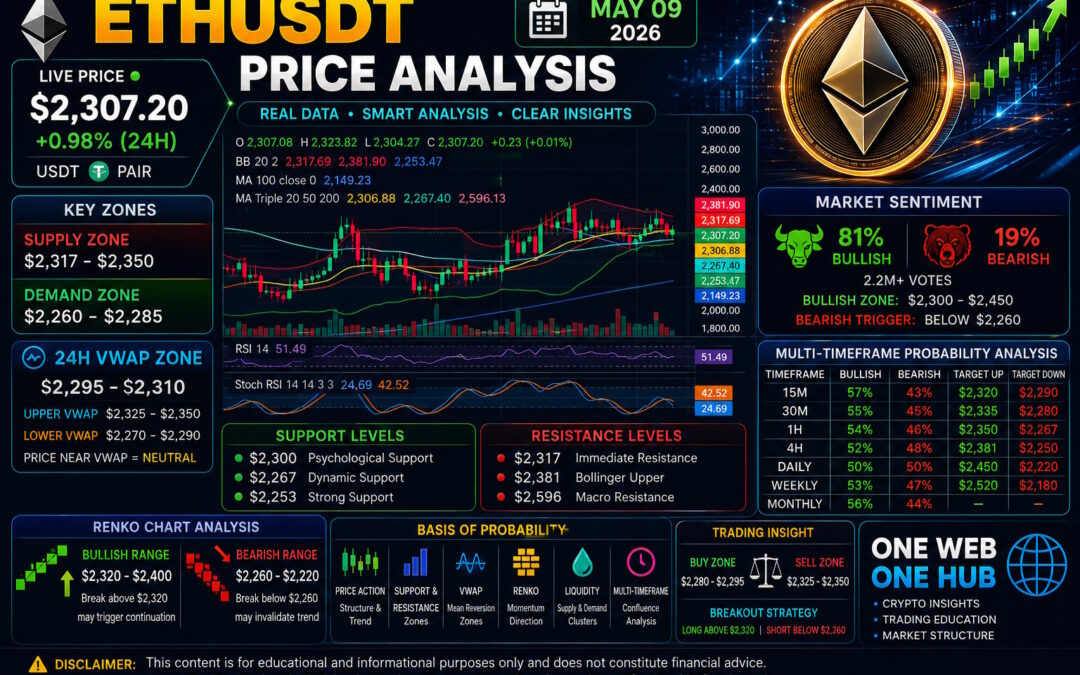
According to the latest live market snapshot from CoinMarketCap, Ethereum (ETHUSDT) is trading near $2,307.20, reflecting a modest +0.98% gain over the last 24 hours.
ETH is currently consolidating after a recent recovery phase, with price hovering around key moving averages while traders monitor breakout potential.
Market Structure Overview
Short-Term Structure
Ethereum currently shows:
Higher lows forming near $2,260
Repeated rejection near $2,320
Compression around the $2,300 range
This structure suggests accumulation with moderate bullish pressure.
Higher Timeframe Context
ETH remains inside a broader macro range:
$2,150 – $2,450
Price remains near the center of the range, indicating equilibrium before the next major move.
Key Support and Resistance Levels
Immediate Support
$2,300 – Psychological support
$2,267 – Dynamic support zone
$2,253 – Bollinger lower band support
Major Resistance
$2,317 – Immediate resistance
$2,381 – Bollinger upper resistance
$2,596 – Macro resistance zone
Demand and Supply Zones
Demand Zones
Primary Demand
$2,260 – $2,285
Secondary Demand
$2,220 – $2,250
Macro Demand
$2,150 – $2,180
These areas are likely to attract buyers if ETH retraces lower.
Supply Zones
Primary Supply
$2,317 – $2,350
Secondary Supply
$2,380 – $2,450
Macro Supply
$2,500 – $2,600
These zones may trigger profit-taking and short-term selling pressure.
Estimated 24H VWAP Analysis
VWAP Core Zone
$2,295 – $2,310
Upper VWAP Deviation
$2,325 – $2,350
Lower VWAP Deviation
$2,270 – $2,290
VWAP Insight
ETH is trading directly near the estimated VWAP equilibrium zone.
Above VWAP = bullish intraday control
Below VWAP = bearish continuation risk
Current positioning suggests a neutral-to-bullish intraday structure.
Renko Chart Analysis
Current Renko Structure
Renko bricks continue showing a gradual bullish transition after prior consolidation.
Bullish Renko Range
$2,320 – $2,400
Break above $2,320 could trigger continuation toward upper supply zones.
Bearish Renko Range
$2,260 – $2,220
Break below $2,260 may invalidate the current bullish structure.
Multi-Timeframe Price Probability Analysis
15-Minute Timeframe
Bullish → 57% (Target: $2,320)
Bearish → 43% (Target: $2,290)
30-Minute Timeframe
Bullish → 55% (Target: $2,335)
Bearish → 45% (Target: $2,280)
1-Hour Timeframe
Bullish → 54% (Target: $2,350)
Bearish → 46% (Target: $2,267)
4-Hour Timeframe
Bullish → 52% (Target: $2,381)
Bearish → 48% (Target: $2,250)
Daily Timeframe
Bullish → 50% (Target: $2,450)
Bearish → 50% (Target: $2,220)
Weekly Timeframe
Bullish → 53% (Target: $2,520)
Bearish → 47% (Target: $2,180)
Monthly Timeframe
Bullish → 56%
Bearish → 44%
Macro structure continues favoring long-term accumulation while above major support.
Market Sentiment Analysis
Sentiment Snapshot
Community sentiment visible on CoinMarketCap currently shows:
81% Bullish
19% Bearish
Sentiment Price Range
Bullish Sentiment Zone
$2,300 – $2,450
Bearish Trigger Zone
Below $2,260
Current Interpretation
Retail sentiment remains strongly bullish as Ethereum maintains higher lows and stability above critical support.
Basis of Probability Methodology
This analysis combines:
Price action structure analysis
Moving average interaction
VWAP equilibrium estimation
Renko momentum direction
Supply and demand liquidity mapping
Multi-timeframe confluence modeling
The goal is to create realistic probability scenarios rather than fixed predictions.
Trading Insight
Intraday Strategy
Buy Zone
$2,280 – $2,295
Sell Zone
$2,325 – $2,350
Breakout Strategy
Long above $2,320
Short below $2,260
Educational Disclaimer
This content is for educational and informational purposes only and should not be considered financial advice.
Cryptocurrency trading involves significant risk and volatility. Always conduct your own research and consult a licensed financial advisor before making investment decisions.
One Web One Hub – Learn Markets with Confidence

09 May 2026 ETHUSDT FI (Referral Link)
At One Web One Hub, our mission is to simplify complex crypto market movements into actionable educational insights.
What You’ll Learn
Daily ETH and BTC analysis
Multi-timeframe trading setups
Probability-based market forecasting
Trading psychology and risk management
Whether you’re a beginner or an experienced trader, One Web One Hub helps you stay informed, disciplined, and ahead of the market.
One Web. One Hub. One smarter trading journey.
Previous Post ETHUSDT – Probability Analysis for May 02, 2026


