BITCOINUSDT – Probability Analysis for May 08, 2026
Bitcoin (BTC/USDT) Price Analysis – May 08, 2026
Live BTC Market Snapshot
Based on the latest market structure visible from TradingView and CoinMarketCap data:
-
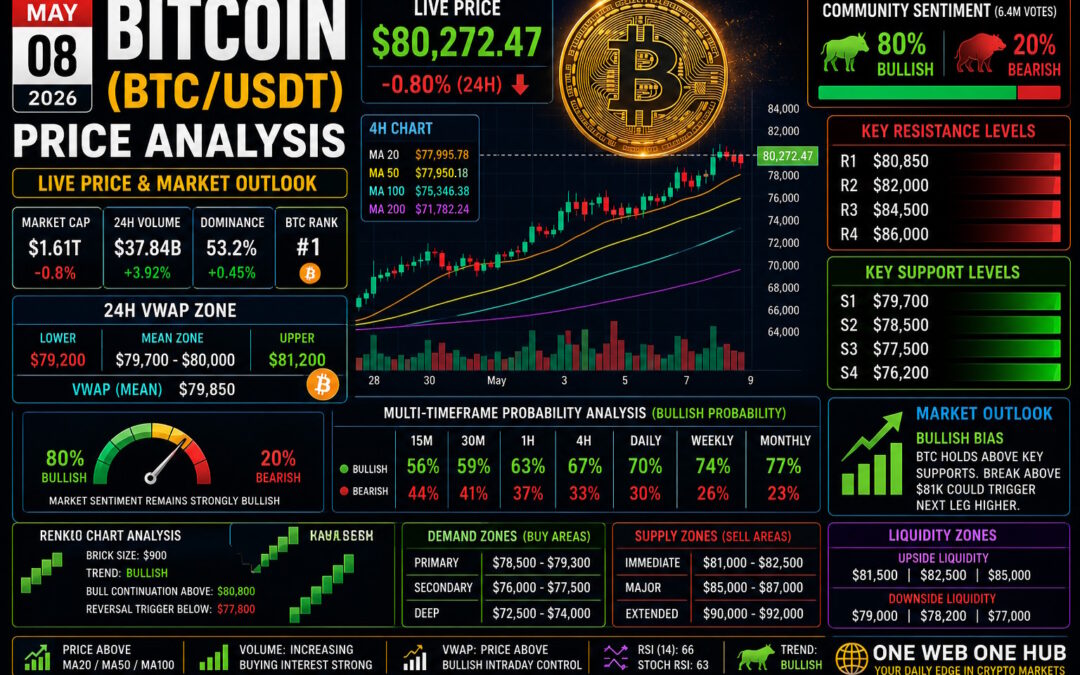
Live BTC Price: $80,272.47
-
24H Change: -0.80%
-
Market Cap: $1.61T
-
24H Volume: $37.84B
-
Community Sentiment: 80% Bullish / 20% Bearish
Bitcoin continues trading near a major psychological resistance zone above $80K while maintaining strong macro bullish structure despite minor intraday weakness.
Current Market Structure Overview
BTC remains inside an active bullish continuation structure after reclaiming higher liquidity zones above $78K. Current price action reflects profit-taking pressure while institutional demand still appears active near support levels.
Key Market Observations
-
Price remains above major moving averages
-
Intraday volatility increasing near resistance
-
Bullish sentiment remains dominant
-
Buyers defending dips aggressively
-
Liquidity clusters forming above $81K
Methodology Behind Probability Analysis
Technical Variables Used
Core Technical Inputs
-
RSI and Stochastic RSI posture
-
Bollinger Band expansion behavior
-
Multi-timeframe trend alignment
-
Moving average positioning
-
Volume reaction around resistance
Smart Money & Liquidity Inputs
-
Order-flow imbalance zones
-
Whale accumulation estimates
-
Stop-loss liquidity clusters
-
Historical BTC breakout behavior
Probability Scale
-
50% = neutral market condition
-
60%+ = directional edge
-
70%+ = strong continuation trend
Multi-Timeframe BTC/USDT Probability Analysis
15-Minute Timeframe
Bias: Intraday Bullish Consolidation
-
Bullish Probability: 56%
-
Bearish Probability: 44%
Expected Price Range
-
Upside: $80,850
-
Downside: $79,700
Insight
Short-term structure favors buyers while price holds above intraday VWAP.
30-Minute Timeframe
Bias: Bullish Recovery Structure
-
Bullish Probability: 59%
-
Bearish Probability: 41%
Expected Range
-
Upside: $81,300
-
Pullback: $79,300
Insight
Momentum building beneath major breakout zone.
1-Hour Timeframe
Bias: Breakout Continuation
-
Bullish Probability: 63%
-
Bearish Probability: 37%
Expected Range
-
Target: $82,000
-
Support Retest: $78,900
Insight
Higher highs and strong buying pressure remain visible.
4-Hour Timeframe
Bias: Strong Bullish Trend
-
Bullish Probability: 67%
-
Bearish Probability: 33%
Expected Range
-
Upside: $84,500
-
Pullback: $77,500
Insight
Macro trend remains bullish while above key support.
Daily Timeframe
Bias: Bullish Expansion Phase
-
Bullish Probability: 70%
-
Bearish Probability: 30%
Expected Range
-
Resistance: $86,000
-
Support: $76,200
Insight
Daily chart structure supports continued upside expansion.
Weekly Timeframe
Bias: Macro Bull Cycle
-
Bullish Probability: 74%
-
Bearish Probability: 26%
Expected Range
-
Upside: $90,000
-
Support: $72,000
Insight
Institutional accumulation still appears active.
Monthly Timeframe
Bias: Long-Term Bullish Continuation
-
Bullish Probability: 77%
-
Bearish Probability: 23%
Expected Range
-
Bull Case: $100,000+
-
Bear Case: $68,000
Insight
BTC remains positioned in a powerful long-cycle expansion phase.
Renko Chart Analysis
Estimated Renko Brick Size: $900
Current Renko Trend
-
Consecutive bullish bricks active
-
Momentum slowing slightly near resistance
-
No confirmed bearish reversal yet
Renko Price Levels
-
Bull Continuation Above: $80,800
-
Momentum Expansion Zone: $82,500
-
Reversal Trigger Below: $77,800
Insight
Renko structure still favors continuation unless support fails aggressively.
Demand Zones
Institutional Buying Areas
Primary Demand Zone
-
$78,500 – $79,300
Secondary Demand Zone
-
$76,000 – $77,500
Deep Accumulation Zone
-
$72,500 – $74,000
Supply Zones
Major Selling Pressure Areas
Immediate Supply
-
$81,000 – $82,500
Major Supply Zone
-
$85,000 – $87,000
Extended Distribution Zone
-
$90,000 – $92,000
Support & Resistance Levels
Key Support Levels
-
$79,700
-
$78,500
-
$77,500
-
$76,200
Key Resistance Levels
-
$80,850
-
$82,000
-
$84,500
-
$86,000
VWAP Analysis
Estimated Session VWAP
-
VWAP Mean: $79,850
Interpretation
-
Price above VWAP = bullish intraday control
-
Pullbacks toward VWAP = potential accumulation opportunities
-
Acceptance below VWAP may signal temporary weakness
24H VWAP Zone Analysis
Estimated 24H Fair Value Zone
-
Lower Band: $79,200
-
Mean Zone: $79,700 – $80,000
-
Upper Band: $81,200
Insight
BTC trading above the 24H VWAP mean zone suggests buyers remain dominant despite temporary pullbacks.
Sentiment Analysis
Current Market Sentiment
Estimated Market Sentiment
-
Bullish: 80%
-
Bearish: 20%
Interpretation
Retail and institutional sentiment remain optimistic while BTC trades above major breakout zones.
Sentiment Price Zones
-
Strong Bullish Continuation Above: $81,000
-
Neutral Consolidation Zone: $79,000 – $81,000
-
Bearish Shift Below: $78,000
Smart Money & Liquidity Zones
Upside Liquidity Targets
-
$81,500
-
$82,500
-
$85,000
Downside Liquidity Pools
-
$79,000
-
$78,200
-
$77,000
Expect volatility spikes and stop hunts around these levels.
Educational Trading Insights
Conservative Trading Approach
Wait for breakout confirmation above resistance or buy reactions near demand zones.
Aggressive Trading Approach
Trade momentum continuation with disciplined stop-loss management.
Risk Reminder
Markets near psychological resistance often experience sudden volatility spikes.
Disclaimer
This content is for educational and informational purposes only and does not constitute financial advice, investment advice, or trading recommendations. Cryptocurrency markets are highly volatile and risky. Always perform your own research and consult a licensed financial professional before investing.
Grow with One Web One Hub
08 May 2026 BITCOINUSDT FI (Referral Link)
Your Daily Source for Crypto Intelligence
At One Web One Hub, we transform complex crypto market movements into educational insights that help traders and investors understand the market with clarity.
What do you get?
-
Daily Bitcoin & crypto market analysis
-
Smart money concepts simplified
-
Multi-timeframe forecasting
-
VWAP, Renko, and sentiment insights
-
Educational trading breakdowns
Why support and follow?
Because consistent market education creates smarter market participants.
Stay connected with One Web One Hub and build your edge in crypto through reliable, engaging, and insight-driven content every day.
Previous Post BITCOINUSDT – Probability Analysis for May 01, 2026
Next Post BITCOINUSDT – Probability Analysis for May 15, 2026


