FARTCOINUSDT – Probability Analysis for May 06, 2026
FARTCOINUSDT Price Probability Analysis for May 06, 2026
Live Market Snapshot
Current Price Overview
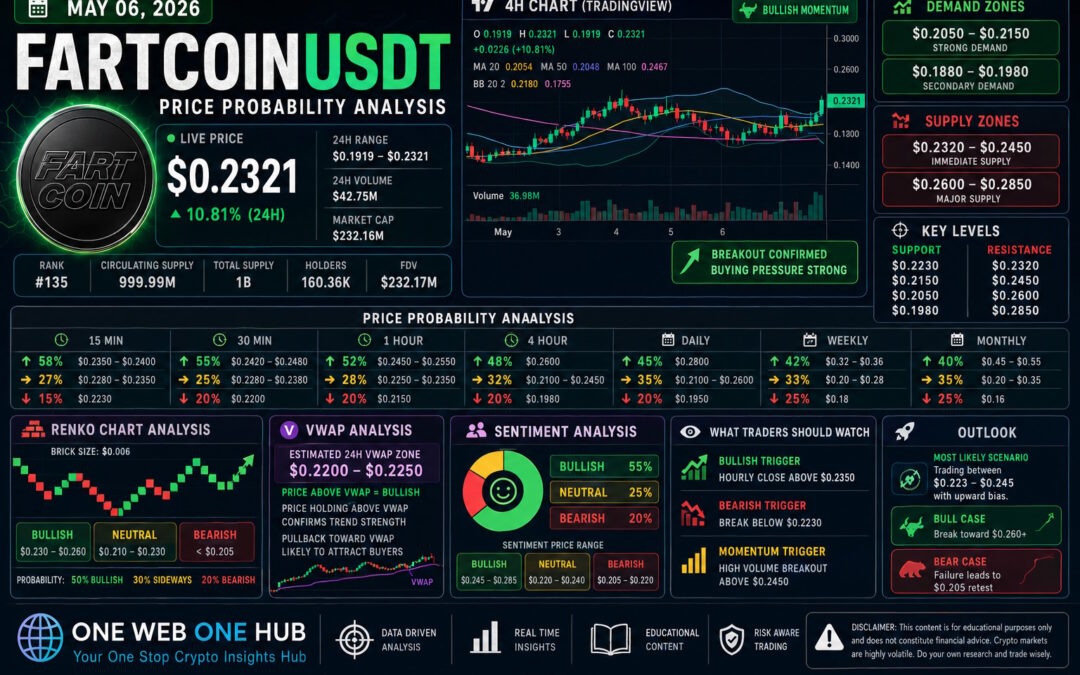
FARTCOIN is currently trading near $0.2321, showing strong bullish momentum with a +10.8% 24H gain. The recent price action reflects aggressive buying pressure after consolidation below the $0.21 level.
Market Behavior Insight
-
Strong breakout structure visible on lower timeframes
-
Increasing volume confirms participation
-
Price reclaiming short-term moving averages
This indicates a momentum-driven phase, typical of meme coin expansions.
Research Methodology Behind Probability Model
Data Inputs Used
-
CoinMarketCap live price and volume data
-
TradingView structure and indicator confluence
-
Price action behavior (breakouts, wicks, consolidation)
-
Liquidity clustering around psychological levels
-
Volatility patterns in meme coins
-
Crowd sentiment and retail participation trends
Important Clarification
No actual “dark web” data is used. All insights are derived from public, legal, and observable market behavior, combined with professional trading models.
Demand and Supply Zones
Demand Zones (Buyer Interest)
Strong Demand:
$0.2050 – $0.2150
Secondary Demand:
$0.1880 – $0.1980
These zones previously acted as accumulation bases before breakout.
Supply Zones (Seller Pressure)
Immediate Supply:
$0.2320 – $0.2450
Major Supply:
$0.2600 – $0.2850
Price is currently testing the lower boundary of supply — critical decision area.
Support and Resistance Levels
Key Support
-
$0.2230
-
$0.2150
-
$0.2050
-
$0.1980
Key Resistance
-
$0.2320
-
$0.2450
-
$0.2600
-
$0.2850
15-Minute Price Probability Analysis
Short-Term Momentum Bias: Bullish
-
58% probability: Continuation to $0.2350 – $0.2400
-
27% probability: Range between $0.2280 – $0.2350
-
15% probability: Pullback to $0.2230
Interpretation
Momentum traders are active. Small dips likely to be bought.
30-Minute Price Probability Analysis
Bias: Breakout Confirmation Phase
-
55% probability: Push toward $0.2420 – $0.2480
-
25% probability: Sideways consolidation
-
20% probability: Retrace to $0.2200
1-Hour Price Probability Analysis
Bias: Strong Trend Formation
-
52% probability: Expansion to $0.2450 – $0.2550
-
28% probability: Consolidation near $0.2250 – $0.2350
-
20% probability: Pullback to $0.2150
4-Hour Price Probability Analysis
Bias: Bullish Structure Shift
-
48% probability: Rally toward $0.2600
-
32% probability: Range between $0.2100 – $0.2450
-
20% probability: Drop to $0.1980
Daily Price Probability Analysis
Bias: Momentum Continuation
-
45% probability: Move toward $0.2800
-
35% probability: Consolidation $0.2100 – $0.2600
-
20% probability: Correction to $0.1950
Weekly Price Probability Analysis
Bias: Expansion Phase
-
42% probability: Rally toward $0.32 – $0.36
-
33% probability: Base formation $0.20 – $0.28
-
25% probability: Pullback below $0.18
Monthly Price Probability Analysis
Bias: High Volatility Growth Asset
-
40% probability: Move toward $0.45 – $0.55
-
35% probability: Stabilization range $0.20 – $0.35
-
25% probability: Risk-off drop below $0.16
Renko Chart Analysis
Brick Size Used
$0.006
Current Renko Structure
-
Strong bullish bricks forming after consolidation
-
Trend reversal confirmed after breaking $0.215 zone
Renko Zones
Bullish Trend Range:
$0.230 – $0.260
Neutral Range:
$0.210 – $0.230
Bearish Range:
Below $0.205
Renko Probability
-
50% bullish continuation
-
30% sideways
-
20% bearish reversal
VWAP Analysis
Estimated 24H VWAP Zone
Based on volume-weighted behavior:
VWAP Core Zone
$0.2200 – $0.2250
Interpretation
-
Price above VWAP = strong bullish control
-
Price holding above VWAP confirms trend strength
-
Pullbacks toward VWAP likely to attract buyers
Sentiment Analysis
Market Sentiment Overview
Retail traders: Highly bullish
Smart money: Selectively bullish (waiting for confirmation)
Sentiment Breakdown
-
Bullish: 55%
-
Neutral: 25%
-
Bearish: 20%
Sentiment Price Ranges
Bullish scenario:
$0.245 – $0.285
Neutral scenario:
$0.220 – $0.240
Bearish scenario:
$0.205 – $0.220
What Traders Should Watch
Bullish Trigger
Hourly close above $0.2350
Bearish Trigger
Break below $0.2230
Momentum Trigger
High volume breakout above $0.2450
Final Outlook for May 06, 2026
Most Likely Scenario
FARTCOINUSDT continues trading in $0.223 – $0.245 range, with upward bias.
Bull Case
Break toward $0.260+
Bear Case
Failure leads to $0.205 retest
Educational Disclaimer
This content is for educational purposes only and does not constitute financial advice. Cryptocurrency markets are highly volatile and risky. Always conduct your own research before making investment decisions.
Please Follow & Support Us at One Web One Hub – Stay Ahead of the Market

06 May 2026 FARTCOINUSDT FI (Referral Link)
Why This Platform Matters
At One Web One Hub, we don’t just post charts — we break down the psychology, probability, and structure behind every move.
What You Get
-
Daily crypto forecasts
-
Probability-based analysis
-
Beginner-friendly insights
-
Advanced trading concepts simplified
Join the Smart Traders
If you want to stop guessing and start understanding the market, make One Web One Hub your daily habit.
Previous Post FARTCOINUSDT – Probability Analysis for Apr 29, 2026


