ADAUSDT – Probability Analysis for Apr 27, 2026
ADAUSDT Price Analysis – April 27, 2026
Current Market Overview
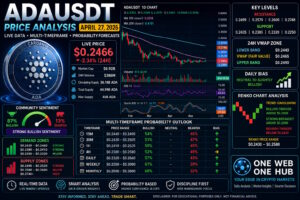
ADAUSDT is trading near $0.2466 based on the latest live market snapshot provided. Cardano is showing short-term weakness in the 24-hour window, but price remains above recent swing lows, indicating that buyers are still defending key demand levels.
Live Market Snapshot
-
Current Price: $0.2466
-
24H Change: -2.34%
-
24H Volume: ~$386M
-
Market Cap: ~$8.92B
-
Community Sentiment: 87% Bullish / 13% Bearish
Despite the daily decline, sentiment remains strongly optimistic, often seen during accumulation phases.
Market Structure Analysis
Short-Term Trend
The lower timeframe trend is consolidating after a recent decline. Price is attempting to stabilize above $0.2430 – $0.2460.
Mid-Term Trend
The 4H chart still reflects a broad sideways structure with lower volatility. Momentum remains neutral unless resistance is broken.
Long-Term Trend
ADA remains in a macro recovery zone, but momentum has slowed. Longer-term upside depends on reclaiming higher resistance bands.
Demand and Supply Zones
Demand Zones
-
$0.2430 – $0.2460 → Immediate buyer support
-
$0.2380 – $0.2410 → Strong short-term demand
-
$0.2250 – $0.2320 → Major accumulation zone
Supply Zones
-
$0.2490 – $0.2520 → Immediate seller pressure
-
$0.2580 – $0.2660 → Major resistance zone
-
$0.2740+ → Higher timeframe supply
Support and Resistance Levels
Support Levels
-
$0.2435
-
$0.2385
-
$0.2320
-
$0.2250
Resistance Levels
-
$0.2499
-
$0.2579
-
$0.2600
-
$0.2748
24H VWAP Analysis
Estimated VWAP Zone
Using visible intraday clustering, candle rotations, and recent average trade zones:
-
Lower VWAP Band: $0.2440
-
VWAP Fair Value: $0.2465
-
Upper VWAP Band: $0.2490
VWAP Interpretation
-
Above $0.2490 → Bullish short-term control
-
Near $0.2465 → Balanced market
-
Below $0.2440 → Bearish pressure zone
Current price near VWAP fair value indicates indecision and a likely setup for the next directional move.
Multi-Timeframe Price Probability Analysis
15-Minute Timeframe
Range
$0.2440 – $0.2490
Probability
-
Bullish Bounce: 54%
-
Bearish Continuation: 46%
Short-term bounce potential exists from support.
30-Minute Timeframe
Range
$0.2430 – $0.2505
Probability
-
Bullish: 53%
-
Bearish: 47%
Mild recovery attempt underway.
1-Hour Timeframe
Range
$0.2410 – $0.2535
Probability
-
Bullish: 55%
-
Bearish: 45%
Recovery possible if price holds above $0.2430.
4-Hour Timeframe
Range
$0.2380 – $0.2580
Probability
-
Neutral/Bullish: 52%
-
Bearish: 48%
Range-bound market with slight bullish tilt.
Daily Timeframe
Range
$0.2320 – $0.2660
Probability
-
Bullish Recovery: 57%
-
Bearish Continuation: 43%
Price remains in a larger consolidation band.
Weekly Timeframe
Range
$0.2200 – $0.3000
Probability
-
Bullish Expansion: 61%
-
Sideways/Bearish: 39%
Weekly structure still constructive.
Monthly Timeframe
Range
$0.2000 – $0.3800
Probability
-
Macro Recovery: 68%
-
Bearish Continuation: 32%
Long-term recovery potential remains valid.
Renko Chart Analysis
Renko Trend Status
Recent decline likely printed multiple bearish bricks, but price is now compressing near support.
Renko Key Levels
-
Bullish Reversal Trigger: Above $0.2500
-
Strong Breakout Trigger: Above $0.2580
-
Bearish Continuation: Below $0.2430
Renko Price Range
$0.2430 – $0.2580
Renko suggests transition from bearish pressure toward consolidation.
Sentiment Analysis
Crowd Sentiment
-
Bullish: 87%
-
Bearish: 13%
Sentiment Interpretation
Community sentiment remains highly optimistic despite recent weakness. This can support rebounds, but excessive optimism may also slow immediate upside if traders chase entries.
Sentiment Price Zones
-
Bullish Zone: $0.2500 – $0.2660
-
Neutral Zone: $0.2430 – $0.2500
-
Bearish Zone: Below $0.2430
Basis of Probability Analysis
Inputs Used
-
Real-time chart data from provided market snapshot
-
Price structure and candle behavior
-
RSI and momentum readings
-
Support/resistance reactions
-
Volume participation
-
VWAP estimated fair value zones
-
Renko trend logic
-
Community sentiment positioning
-
Multi-timeframe confluence
Methodology
Probabilities represent directional bias based on current conditions, not guaranteed outcomes.
High Probability Trading Scenarios
Bullish Scenario
Break above $0.2499 – $0.2520 may open upside toward $0.2580 – $0.2660.
Consolidation Scenario
Price rotates between $0.2435 – $0.2500 while building liquidity.
Bearish Scenario
Loss of $0.2430 could trigger downside toward $0.2385 and deeper support.
Trading Insight Summary
-
Current Bias: Neutral to Slightly Bullish
-
Key Trigger Up: $0.2520
-
Key Trigger Down: $0.2430
-
Momentum: Recovering
-
Ideal Approach: Wait for breakout confirmation or support reaction
Disclaimer
This content is for educational and informational purposes only and does not constitute financial advice, investment advice, or trading recommendations. Cryptocurrency markets are volatile and involve risk. Always do your own research before making investment decisions.
Please Follow & Bookmark One Web One Hub – Your Daily Crypto Advantage
27 Apr 2026 ADAUSDT FI (Referral Link)
At One Web One Hub, we turn complex charts into practical educational insights.
What Readers Get
-
Weekly ADAUSDT forecasts
-
Technical analysis made simple
-
Multi-timeframe probability models
-
Smart money concepts explained
-
Consistent market education
Why Return Daily
Markets evolve fast. Staying informed gives you an edge, and repeated exposure builds stronger decision-making.
Join the Hub
Bookmark One Web One Hub, return for the next ADA update, and keep sharpening your market edge one chart at a time.
Previous Post ADAUSDT – Probability Analysis for Apr 20, 2026
Next Post ADAUSDT – Probability Analysis for May 04, 2026


