XRPUSDT – Probability Analysis for Apr 19, 2026
XRPUSDT Price Analysis – April 19, 2026
Live Market Overview
Based on the latest market snapshot from CoinMarketCap and TradingView:
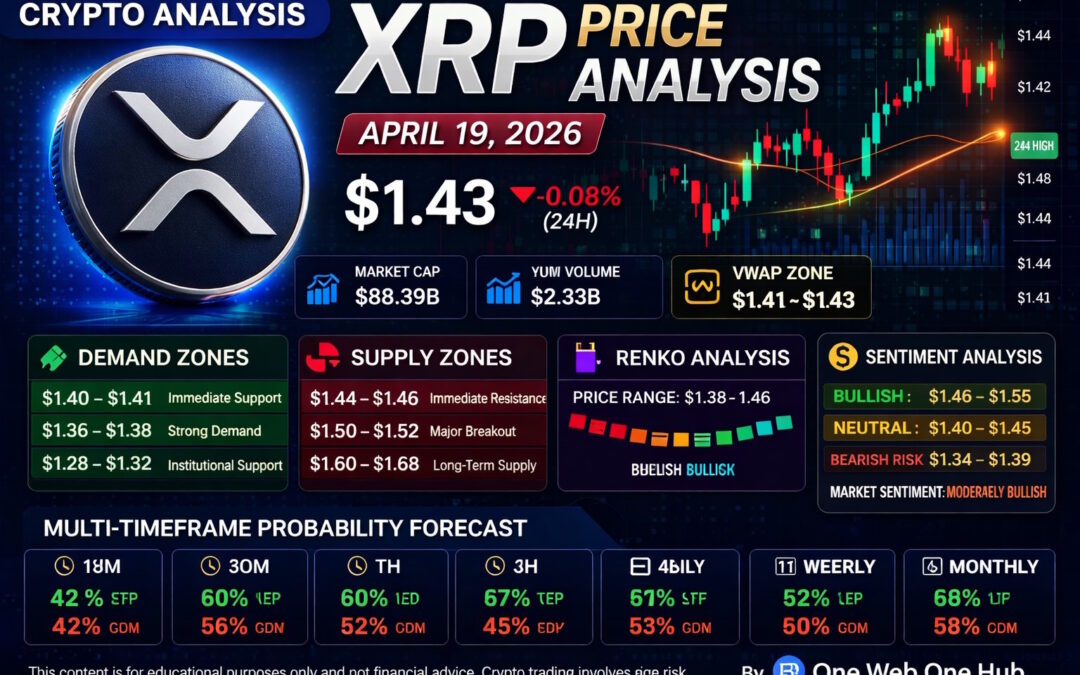
- Current XRP Price: $1.43
- 24H Change: +0.07%
- 24H High: $1.44
- 24H Low: $1.41
- Market Cap: $88.39B
- 24H Volume: $2.33B
- RSI (24H): 57.60
- Stochastic RSI: 80+ (overbought region)
XRP is currently showing bullish short-term momentum, trading above immediate support while attempting to challenge higher resistance zones.
Current Market Structure
Short-Term Trend
- Price recently bounced from $1.38 support.
- Strong upward momentum pushed XRP toward $1.44.
- Buyers currently defending gains above $1.41.
This suggests a short-term bullish continuation setup.
Higher Timeframe Context
- XRP remains below the macro resistance zone near $1.52.
- Weekly structure still bullish above $1.30.
- Momentum improving after prior consolidation.
Overall structure is neutral-bullish with breakout potential.
Demand and Supply Zones
Major Demand Zones
$1.40 – $1.41
Immediate support zone.
$1.36 – $1.38
Strong recent accumulation zone.
$1.28 – $1.32
Higher timeframe institutional demand zone.
Major Supply Zones
$1.44 – $1.46
Immediate resistance zone.
$1.50 – $1.52
Major breakout barrier.
$1.60 – $1.68
Longer-term supply zone.
Support and Resistance Levels
Key Support Levels
- $1.41
- $1.38
- $1.35
- $1.30
Key Resistance Levels
- $1.44
- $1.46
- $1.52
- $1.60
A breakout above $1.46 may accelerate bullish momentum.
24-Hour VWAP Analysis
Estimated VWAP Zone
$1.41 – $1.43
Interpretation
- Price above VWAP = bullish control
- Price below VWAP = bearish weakness
- Price near VWAP = consolidation equilibrium
Current XRP price is slightly above VWAP, suggesting buyers currently control the session.
Renko Chart Analysis
Current Renko Structure
- Consecutive green bricks forming.
- Minor pullback bricks absorbed quickly.
- Trend remains bullish unless $1.40 breaks.
Renko Price Range
$1.38 – $1.46
Key Renko Signals
Bullish breakout trigger:
Above $1.46
Bearish reversal trigger:
Below $1.40
Renko structure supports continuation higher if resistance breaks.
Multi-Timeframe Price Probability Analysis
Probabilities are based on:
- Trend momentum
- RSI/Stochastic behavior
- Volume structure
- VWAP position
- Support/resistance reactions
- Renko directional bias
15-Minute Timeframe
Bias: Bullish
- Upside Probability: 62%
- Downside Probability: 38%
Expected Range: $1.42 – $1.45
30-Minute Timeframe
Bias: Bullish
- Upside Probability: 60%
- Downside Probability: 40%
Expected Range: $1.41 – $1.46
1-Hour Timeframe
Bias: Bullish
- Upside Probability: 58%
- Downside Probability: 42%
Expected Range: $1.40 – $1.47
4-Hour Timeframe
Bias: Neutral-Bullish
- Upside Probability: 55%
- Downside Probability: 45%
Expected Range: $1.38 – $1.50
Daily Timeframe
Bias: Bullish
- Upside Probability: 57%
- Downside Probability: 43%
Expected Range: $1.35 – $1.52
Weekly Timeframe
Bias: Bullish
- Upside Probability: 61%
- Downside Probability: 39%
Expected Range: $1.30 – $1.65
Monthly Timeframe
Bias: Neutral-Bullish
- Upside Probability: 58%
- Downside Probability: 42%
Expected Range: $1.10 – $1.90
Sentiment Analysis
Market Sentiment Overview
Current market sentiment is moderately bullish due to:
- Strong bounce from support
- Positive momentum recovery
- Buyers defending intraday gains
- Increasing attention around breakout setup
Sentiment Price Ranges
Bullish Zone:
$1.46 – $1.55
Neutral Zone:
$1.40 – $1.45
Bearish Risk Zone:
$1.34 – $1.39
Basis of Probability Calculations
This analysis framework uses:
Price Action Structure
Trend continuation and reversal behavior.
Volume Analysis
Buying and selling pressure at zones.
Momentum Indicators
RSI, Stochastic RSI, expansion signals.
VWAP Positioning
Intraday institutional bias.
Renko Confirmation
Noise-free trend direction.
Historical Reactions
Repeated support/resistance behavior.
These factors create probability scenarios rather than certainty.
Key Signals to Watch
Bullish Signals
- Break above $1.46
- Strong close above $1.52
- Holding above VWAP
Bearish Signals
- Rejection at $1.44 – $1.46
- Break below $1.40
- Weakening volume on rallies
Continue Learning With One Web One Hub (Please Bookmark & Support)
19 Apr 2026 XRPUSDT FI (Referral Link)
If you want more data-driven crypto insights, One Web One Hub helps traders and investors understand markets clearly.
What you’ll get:
- Weekly XRP analysis
- Real crypto market breakdowns
- Smart money concepts explained simply
- Practical technical education
- Better trading confidence through structure
Stay ahead of the market with One Web One Hub.
Educational Disclaimer
This content is for educational and informational purposes only and does not constitute financial advice.
Cryptocurrency markets are highly volatile and risky. Always do your own research and consult a qualified financial advisor before making investment decisions.
Previous Post XRPUSDT – Probability Analysis for Apr 12, 2026
Next Post XRPUSDT – Probability Analysis for Apr 26, 2026


