ETHUSDT – Probability Analysis for Apr 18, 2026
ETHUSDT Price Analysis – April 18, 2026
Current ETHUSDT Live Price
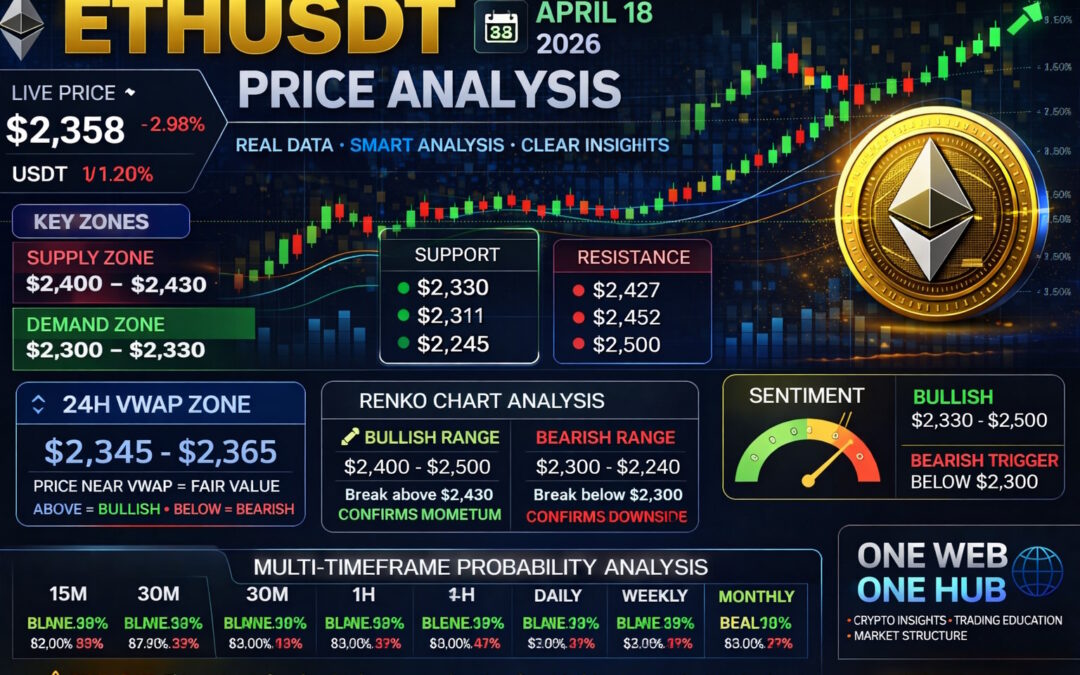
Based on the live market snapshot provided from CoinMarketCap, Ethereum (ETHUSDT) is currently trading near $2,358.66, showing a -2.98% move over the last 24 hours.
Despite the daily pullback, Ethereum remains above major structural support zones, while price is now testing an important decision area between recovery continuation and short-term rejection.
Market Structure Overview
Short-Term Structure
Ethereum is currently showing:
Higher lows from recent sessions
Pullback from local highs near $2,427
Support forming near $2,310 – $2,330
This suggests bullish structure under correction, rather than confirmed reversal.
Higher Timeframe Context
ETH remains inside a broader macro range:
$2,150 – $2,500
Price is now trading in the upper-mid section of the range, which often attracts both buyers and profit takers.
Key Support and Resistance Levels
Immediate Support
$2,330 – Intraday support
$2,311 – Key moving average support
$2,245 – Strong technical support
Major Resistance
$2,427 – Recent high resistance
$2,452 – Upper Bollinger resistance
$2,500 – Macro breakout resistance
Demand and Supply Zones
Demand Zones
Primary Demand
$2,300 – $2,330
Secondary Demand
$2,245 – $2,280
Macro Demand
$2,180 – $2,220
These zones represent areas where buyers may re-enter aggressively.
Supply Zones
Primary Supply
$2,400 – $2,430
Secondary Supply
$2,450 – $2,500
Macro Supply
$2,550 – $2,650
These zones are likely to attract selling pressure if momentum slows.
Estimated 24H VWAP Analysis
VWAP Core Zone
$2,345 – $2,365
Upper VWAP Deviation
$2,390 – $2,425
Lower VWAP Deviation
$2,300 – $2,335
VWAP Insight
ETH is trading near the VWAP core zone, signaling fair value after the pullback.
Above VWAP = bullish recovery bias
Below VWAP = sellers regain control
Current price suggests balanced conditions with recovery potential.
Renko Chart Analysis
Current Structure
Renko bricks show uptrend intact but momentum cooling after recent expansion.
Bullish Renko Range
$2,400 – $2,500
Break above $2,430 may trigger fresh bullish bricks.
Bearish Renko Range
$2,300 – $2,245
Break below $2,300 could shift short-term control to sellers.
Multi-Timeframe Price Probability Analysis
15-Minute Timeframe
Bullish → 58% (Target: $2,385)
Bearish → 42% (Target: $2,330)
30-Minute Timeframe
Bullish → 56% (Target: $2,400)
Bearish → 44% (Target: $2,320)
1-Hour Timeframe
Bullish → 53% (Target: $2,427)
Bearish → 47% (Target: $2,300)
4-Hour Timeframe
Bullish → 51% (Target: $2,452)
Bearish → 49% (Target: $2,280)
Daily Timeframe
Bullish → 49% (Target: $2,500)
Bearish → 51% (Target: $2,245)
Weekly Timeframe
Bullish → 52% (Target: $2,650)
Bearish → 48% (Target: $2,180)
Monthly Timeframe
Bullish → 55%
Bearish → 45%
Macro structure remains constructive unless major support fails.
Market Sentiment Analysis
Sentiment Snapshot
Community sentiment visible on CoinMarketCap shows:
81% Bullish
19% Bearish
Sentiment Price Range
Bullish Sentiment Zone
$2,330 – $2,500
Bearish Trigger Zone
Below $2,300
Current Interpretation
Retail sentiment remains positive despite today’s decline, which often reflects confidence in trend continuation.
Basis of Probability Methodology
This report uses a structured probability model based on:
Price action structure (higher highs / higher lows)
Live support and resistance interaction
VWAP mean reversion zones
Renko trend momentum shifts
Supply and demand liquidity clusters
Multi-timeframe confluence
This creates scenario-based probabilities rather than fixed predictions.
Trading Insight
Intraday Strategy
Buy Zone
$2,330 – $2,345
Sell Zone
$2,390 – $2,425
Breakout Strategy
Long above $2,430
Short below $2,300
Educational Disclaimer
This content is for educational and informational purposes only and should not be considered financial advice.
Cryptocurrency markets are volatile and risky. Always conduct your own research and consult a qualified financial advisor before making investment decisions.
Please Follow & Support One Web One Hub – Your Edge Starts Here

18 Apr 2026 ETHUSDT FI
At One Web One Hub, we turn complex crypto markets into practical insights.
What You’ll Discover
Weekly ETH & BTC market analysis
Probability-based technical breakdowns
Trading education for all skill levels
Smarter strategies with real chart logic
If you want consistent market clarity instead of random noise, make One Web One Hub part of your weekly routine.
Learn smarter. Trade sharper. Grow stronger.
Previous Post ETHUSDT – Probability Analysis for Apr 11, 2026
Next Post ETHUSDT – Probability Analysis for Apr 25, 2026


