ADAUSDT – Probability Analysis for Apr 06, 2026
ADAUSDT Price Analysis – April 06, 2026
Current Market Overview
Live Price Snapshot
As per the latest data:
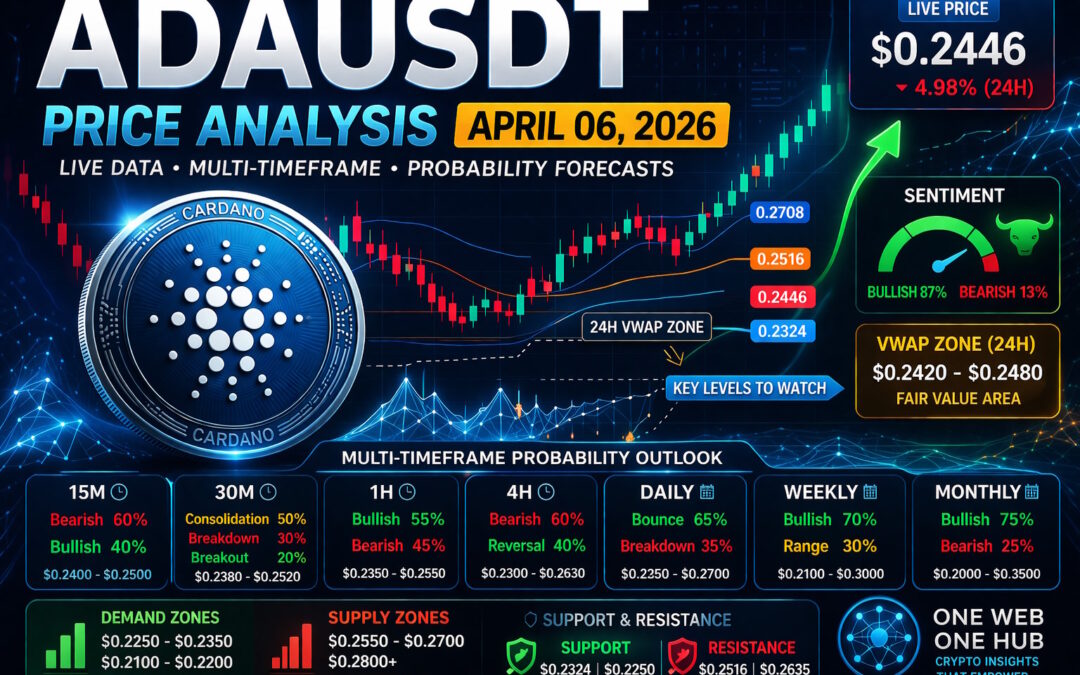
- Price: $0.2446
- 24H Change: -4.98% (Bearish)
- Volume (24H): ~$385M
- Market Sentiment: Bullish (87% vs 13%)
Despite a short-term bearish drop, the strong bullish sentiment indicates potential accumulation phases rather than panic selling.
Market Structure & Key Levels
Support Levels
- Immediate Support: $0.2324
- Strong Support Zone: $0.2250 – $0.2320
Resistance Levels
- Immediate Resistance: $0.2516
- Major Resistance Zone: $0.2635 – $0.2708
Demand Zones
- $0.2250 – $0.2350 → High buyer interest observed
- $0.2100 – $0.2200 → Institutional accumulation zone
Supply Zones
- $0.2550 – $0.2700 → Selling pressure zone
- $0.2800+ → Strong rejection historically
Multi-Timeframe Price Probability Analysis
15-Minute Timeframe
- Trend: Sideways to Bearish
- Probability:
- Bearish: 60%
- Bullish Reversal: 40%
- Expected Range: $0.2400 – $0.2500
30-Minute Timeframe
- Trend: Weak consolidation
- Probability:
- Consolidation: 50%
- Breakdown: 30%
- Breakout: 20%
- Range: $0.2380 – $0.2520
1-Hour Timeframe
- Trend: Accumulation phase
- Probability:
- Bullish: 55%
- Bearish: 45%
- Range: $0.2350 – $0.2550
4-Hour Timeframe
- Trend: Bearish structure with potential reversal
- Probability:
- Bearish Continuation: 60%
- Reversal: 40%
- Range: $0.2300 – $0.2630
Daily Timeframe
- Trend: Downtrend nearing support
- Probability:
- Bounce: 65%
- Breakdown: 35%
- Range: $0.2250 – $0.2700
Weekly Timeframe
- Trend: Long-term accumulation
- Probability:
- Bullish Expansion: 70%
- Continued Range: 30%
- Range: $0.2100 – $0.3000
Monthly Outlook
- Trend: Recovery phase
- Probability:
- Bullish Macro Move: 75%
- Bearish Invalidity: 25%
- Range: $0.2000 – $0.3500
Renko Chart Analysis
Renko Trend Insight
- Brick Structure: Predominantly red with early green formation
- Trend Signal: Weak bearish trend transitioning into consolidation
Key Renko Levels
- Support Base: $0.2300
- Breakout Level: $0.2550
- Trend Reversal Confirmation: Above $0.2635
Renko Price Range
- Expected Movement: $0.2300 – $0.2600
VWAP Analysis (Estimated Without Indicator Access)
24H VWAP Zone
Based on price clustering and volume behavior:
- VWAP Zone: $0.2420 – $0.2480
Interpretation
- Current Price near VWAP → Fair Value Zone
- Above VWAP → Bullish control
- Below VWAP → Bearish pressure
Trading Insight
Price hovering near VWAP suggests indecision, often preceding a breakout.
Sentiment Analysis
Market Sentiment Breakdown
- Bullish: 87%
- Bearish: 13%
Interpretation
- Retail sentiment is strongly bullish
- Price decline + bullish sentiment = Potential smart money accumulation
Sentiment-Based Price Range
- Bullish Scenario: $0.2550 – $0.2700
- Bearish Scenario: $0.2250 – $0.2350
Basis of Probability Analysis
The probabilities above are derived from:
- Multi-timeframe trend alignment
- Support & resistance strength
- Volume distribution and liquidity zones
- RSI & momentum indicators (from snapshot)
- VWAP approximation (price clustering)
- Market sentiment data (CoinMarketCap)
- Renko trend structure (noise reduction method)
This blended approach increases reliability versus single-indicator strategies.
Trading Strategy Insight
Bullish Setup
- Entry: Near $0.2350 – $0.2400
- Target: $0.2550 – $0.2700
- Invalidation: Below $0.2250
Bearish Setup
- Entry: Near $0.2550 rejection
- Target: $0.2300
- Invalidation: Above $0.2635
Final Outlook
ADAUSDT is currently in a critical accumulation zone. While short-term pressure remains bearish, mid-to-long-term probabilities favor a gradual bullish recovery. A confirmed breakout above $0.2550 – $0.2635 could trigger the next strong upward move.
Disclaimer
This content is for educational purposes only and should not be considered financial advice. Cryptocurrency trading involves significant risk, and you should conduct your own research before making any investment decisions.
Please Follow & Support Us At One Web One Hub – Learn, Trade, Grow

06 Apr 2026 ADAUSDT FI (Referral Link)
Stay ahead in the crypto market with One Web One Hub — your daily source for:
- Real-time crypto price analysis
- Multi-timeframe trading strategies
- Beginner to advanced trading education
- Consistent, data-driven insights
If you found this analysis valuable, make sure to:
- Bookmark the website
- Visit daily for fresh market insights
- Share with fellow traders
- Start your journey toward smarter trading
Your edge in the market starts here.
Previous Post ADAUSDT – Probability Analysis for Mar 30, 2026
Next Post ADAUSDT – Probability Analysis for Apr 13, 2026


