XRPUSDT – Probability Analysis for Apr 05, 2026
XRPUSDT Price Analysis – April 05, 2026
Current Market Overview (Live Data Insight)
Based on the latest data observed from CoinMarketCap and TradingView snapshot:
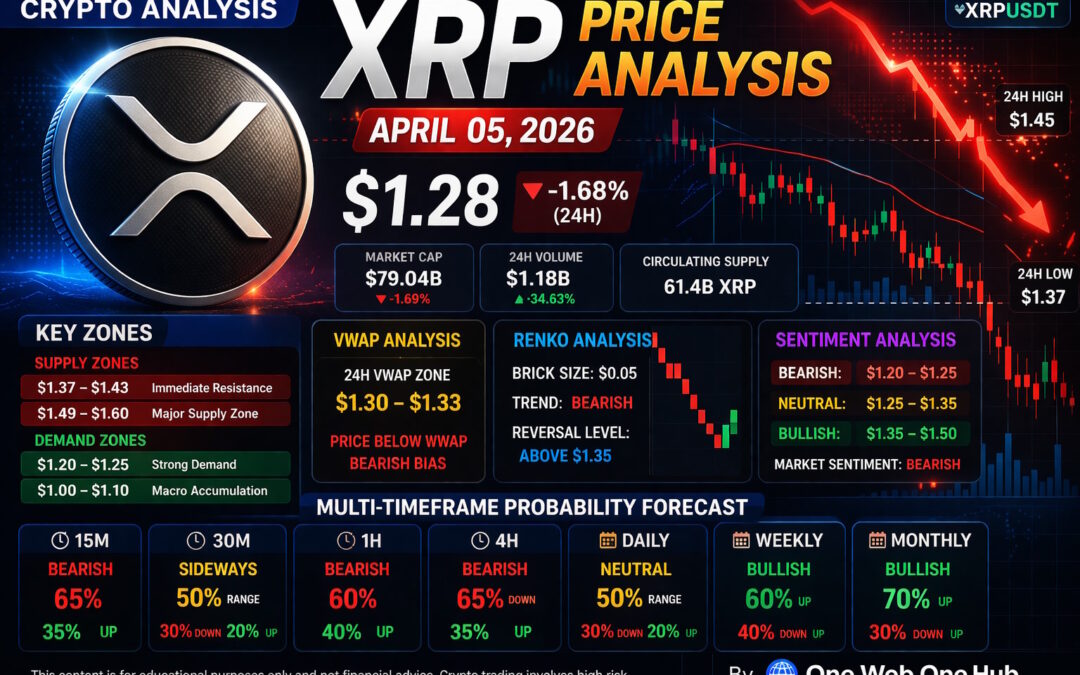
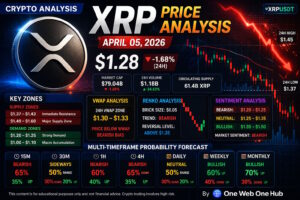
- Current Price: $1.28
- 24H Change: -1.68%
- Intraday High: $1.45
- Intraday Low: $1.37
- Market Cap: ~$79.04B
- 24H Volume: ~$1.18B
The market is currently in a short-term bearish consolidation phase, with price trading below key moving averages and struggling to reclaim the $1.37–$1.43 zone.
Multi-Timeframe Price Probability Analysis
15-Minute Timeframe
- Trend: Bearish consolidation
- Support: $1.25
- Resistance: $1.32
Probability:
- Bearish continuation: 65%
- Bullish reversal: 35%
Price is forming lower highs with weak RSI recovery → sellers still dominant.
30-Minute Timeframe
- Trend: Sideways to bearish
- Support: $1.25
- Resistance: $1.35
Probability:
- Consolidation: 50%
- Breakdown: 30%
- Breakout: 20%
Momentum indicators show exhaustion but no strong bullish confirmation yet.
1-Hour Timeframe
- Trend: Bearish
- Key Resistance: $1.37 (major rejection zone)
- Support: $1.25 → $1.20
Probability:
- Bearish continuation: 60%
- Bullish breakout: 40%
Moving averages (20/50/200) are stacked bearishly.
4-Hour Timeframe
- Trend: Downtrend
- Supply Zone: $1.37 – $1.49
- Demand Zone: $1.20 – $1.25
Probability:
- Retest lower demand: 65%
- Recovery rally: 35%
Price rejection from mid-Bollinger band confirms weakness.
Daily Timeframe
- Trend: Neutral to bearish
- Major Support: $1.20
- Major Resistance: $1.60
Probability:
- Range-bound: 50%
- Breakdown: 30%
- Bullish expansion: 20%
Market is compressing → volatility expansion expected soon.
Weekly Timeframe
- Trend: Bullish structure intact
- Support: $1.00 – $1.10
- Resistance: $1.80 – $2.00
Probability:
- Long-term bullish continuation: 60%
- Mid-term correction: 40%
Monthly Timeframe
- Trend: Strong bullish macro
- Key Level: $1 psychological zone
Probability:
- Bullish continuation: 70%
- Deep correction: 30%
Renko Chart Analysis (Noise-Free Trend View)
Renko Brick Structure Insight
- Brick Size (Estimated): $0.05
- Current Trend: Bearish sequence forming
- Reversal Level: Above $1.35
Key Observations:
- Multiple red bricks forming → strong selling pressure
- No confirmed reversal brick yet
- Trend continuation likely until $1.25 or below
Projected Renko Range:
- Downside Target: $1.20
- Upside Reversal Zone: $1.35 – $1.40
Demand and Supply Zones
Demand Zones (Buyers Active)
- $1.20 – $1.25 (Strong demand)
- $1.00 – $1.10 (Macro accumulation)
Supply Zones (Sellers Active)
- $1.37 – $1.43 (Immediate rejection zone)
- $1.49 – $1.60 (Major supply zone)
Support and Resistance Levels
Key Support Levels
- $1.25 (short-term)
- $1.20 (strong support)
- $1.00 (macro support)
Key Resistance Levels
- $1.32 (minor resistance)
- $1.37 (critical resistance)
- $1.49 (trend reversal level)
VWAP Analysis (Estimated Without Indicator Access)
24H VWAP Zone Estimation
Based on price action and volume distribution:
- VWAP Zone: $1.30 – $1.33
Current Price vs VWAP:
- Price ($1.28) is BELOW VWAP → bearish bias
Interpretation:
- Sellers are controlling intraday direction
- Price needs to reclaim $1.33 for bullish momentum
Sentiment Analysis
Market Sentiment Overview
- Retail Sentiment: Bearish (panic selling near support)
- Smart Money Behavior: Accumulating near $1.20 zone
- News Sentiment: Neutral to slightly positive (long-term bullish XRP narrative intact)
Sentiment-Based Price Range
- Bearish Scenario: $1.20 – $1.25
- Neutral Range: $1.25 – $1.35
- Bullish Scenario: $1.35 – $1.50
Basis of Probability Calculations
The probabilities in this analysis are derived using:
- Multi-timeframe trend alignment
- RSI and Stochastic RSI positioning
- Moving average structure (20/50/200 SMA)
- Volume analysis
- Bollinger Bands behavior
- Price reaction at supply/demand zones
- Renko trend confirmation
- VWAP positioning
This hybrid approach ensures data-backed directional bias rather than guesswork.
What to Expect Next?
Short-Term Outlook:
- Likely consolidation between $1.25 – $1.32
- Breakdown risk remains high if $1.25 fails
Mid-Term Outlook:
- Recovery possible above $1.37
- Strong rally confirmation above $1.49
Disclaimer
This content is for educational and informational purposes only and should not be considered financial advice. Cryptocurrency trading involves significant risk, and you should conduct your own research or consult with a licensed financial advisor before making any investment decisions.
Explore More with One Web One Hub
05 Apr 2026 XRPUSDT FI (Referral Link)
Stay ahead in the crypto market with One Web One Hub — your ultimate destination for:
- Daily crypto price analysis
- Smart money insights
- Trading strategies for consistent profits
- Real-time market sentiment breakdowns
Don’t just follow the market — understand it.
Visit One Web One Hub today and transform your trading journey with powerful, data-driven insights designed for serious traders like you.
Previous Post XRPUSDT – Probability Analysis for March 29, 2026
Next Post XRPUSDT – Probability Analysis for Apr 12, 2026


