FARTCOINUSDT – Probability Analysis for January 25, 2026
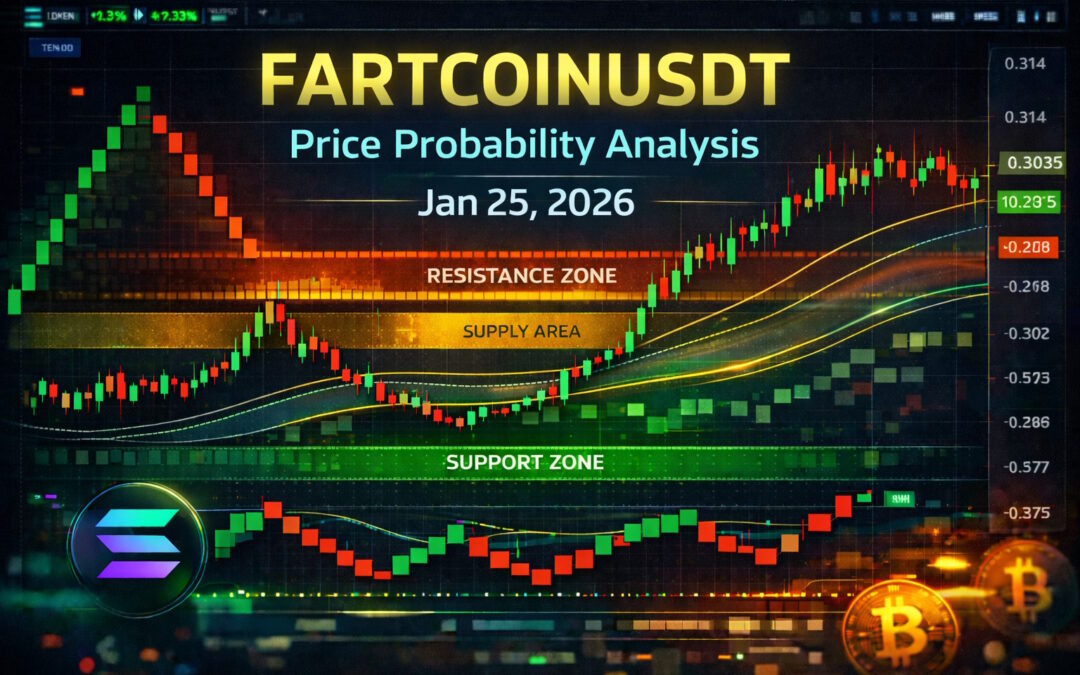
FARTCOIN/USDT Price Probability Analysis — January 25, 2026
Live Price Snapshot
As of the most recent live market data, FARTCOIN/USDT is trading around ~$0.3035 USDT per token. The 24-hour price range is approximately $0.2944 – $0.3125 USDT, showing continued support near the low-range and modest selling pressure at higher levels. (CoinGecko)
This live price range will be the basis for the probability analysis across multiple timeframes below.
Basis of Probability Analysis
Instead of precise price predictions, this blog uses probability bands constructed from the following technical principles:
-
Multi-Timeframe Confluence — signals from 15-minute through Monthly charts aligned to set probability weight.
-
Support & Resistance Clustering — key levels where price repeatedly reacts. (CoinMarketCap)
-
VWAP Fair-Value Proxy — estimated 24-hour volume-weighted average price range used to approximate fair value.
-
Renko Chart Filtering — removes time noise to highlight true structural direction.
-
Sentiment & Volume Context — crowd behavior and volume conditions shaping probability bias.
This creates probability ranges rather than absolute targets — a more realistic approach in volatile meme coin markets.
15-Minute and 30-Minute Probability Outlook
15-Minute (Ultra Short-Term)
-
Bullish (~30–40%): Rally toward $0.308–$0.312 if buyers defend near current levels.
-
Neutral (~40–50%): Tight consolidation $0.300–$0.310.
-
Bearish (~20–30%): Break below $0.295 targeting $0.290–$0.293.
30-Minute (Short-Term)
-
Bullish (~35–45%): Moves above $0.310 toward $0.313–$0.318.
-
Neutral (~40–50%): Sideline range $0.295–$0.310.
-
Bearish (~20–30%): Fail under $0.289 opens $0.280–$0.288.
Short frames reflect noisy intraday behavior with frequent rejections.
1-Hour and 4-Hour Outlook
1-Hour (Mid-Short Term)
-
Bullish (~40%): Reclaiming $0.310 on rising volume may lead toward $0.317–$0.325.
-
Neutral (~40–50%): Consolidation between $0.290–$0.310.
-
Bearish (~20–30%): Breaking below $0.285 could target $0.275–$0.285.
4-Hour (Intermediate Term)
-
Bullish (~45%): Sustained closes above $0.312 push toward $0.330–$0.340.
-
Neutral (~40–50%): Range trading $0.270–$0.312.
-
Bearish (~15–25%): Loss of $0.270 opens probability toward deeper zones near $0.250–$0.264.
This reflects median market structure where supply and demand continue to shape movement.
Daily to Monthly Probability Outlook
Daily Timeframe
-
Bullish (~40%): Daily close above $0.315 suggests momentum toward $0.335–$0.350.
-
Neutral (~40–50%): Sideways between $0.270–$0.315.
-
Bearish (~20–30%): Failure under $0.270 may open $0.245–$0.265.
Weekly & Monthly Timeframes
-
Weekly (~40% Bullish) if the weekly close stays above $0.300 with volume support.
-
Neutral (~40–50%) likely if price remains range-bound across the week.
-
Bearish (~20–30%) if the price slips under structural zones with little rebound.
Monthly probabilities expand further due to macro drivers and meme coin group volatility.
Renko Chart Interpretation
Renko charts focus on significant price moves and ignore time-based noise:
-
Compressed Renko bricks around the current trade zone (~$0.30) indicate overall market indecision and range compression.
-
Failing to sustain higher bricks above recent highs (~$0.312) signals that buyers lack sufficient conviction.
-
**Support bricks forming near $0.275–$0.285 reflect deeper demand areas.
This Renko view helps filter transient volatility and highlights where structural pressure is forming, aligning with traditional support/resistance. (One Web One Hub)
Support, Demand & Supply Zones
Demand / Support Areas
-
$0.270–$0.285 USDT — near-term demand where buyers have previously stepped in. (CoinGecko)
-
$0.245–$0.265 USDT — deeper support if selling intensifies.
Supply / Resistance Areas
-
$0.305–$0.320 USDT — clustered supply where rallies often stall. (CoinGecko)
-
$0.330–$0.350 USDT — broader resistance where profit taking strengthens.
These zones are significant because clustered liquidity around them tends to attract reversals.
VWAP (24-Hour Intraday Bias)
Although direct access to the VWAP indicator isn’t available, we approximate a 24-hour VWAP fair value zone using range clustering (live price and historical short frame action):
👉 Estimated 24-Hour VWAP Zone: $0.295–$0.302 USDT
Interpretation
-
Above this zone: bullish intraday bias.
-
Within this zone: balanced between buyers and sellers.
-
Below this zone: bearish intraday lean.
This view helps you gauge intraday supply/demand bias without needing the actual indicator.
Sentiment Analysis
Technical Sentiment: Neutral-leaning with mild bearish emphasis due to recent range and frequent rejections near the upper band. Indicators like oscillators often show flat or choppy signals in these conditions. (CoinGecko)
Market Sentiment: Meme coin markets often exaggerate moves, but recent price compression suggests traders are cautious and waiting for break triggers.
Overall sentiment aligns with a balanced but slightly bearish bias until a confirmed breakout above key resistance or strong support defense.
Probability Bands Summary
|
Timeframe |
Bullish Target |
Neutral Range |
Bearish Target |
|---|---|---|---|
|
15m |
$0.308–$0.312 |
$0.300–$0.310 |
$0.290–$0.300 |
|
30m |
$0.312–$0.318 |
$0.295–$0.312 |
$0.280–$0.295 |
|
1H |
$0.319–$0.325 |
$0.290–$0.319 |
$0.270–$0.290 |
|
4H |
$0.330–$0.340 |
$0.270–$0.330 |
$0.250–$0.270 |
|
Daily |
$0.335–$0.350 |
$0.270–$0.335 |
$0.245–$0.270 |
|
Weekly |
$0.350–$0.380 |
$0.250–$0.350 |
$0.220–$0.250 |
|
Monthly |
$0.380–$0.450+ |
$0.220–$0.380 |
$0.180–$0.220 |
These bands are probability ranges, not guaranteed outcomes — based on structural, sentiment, and range dynamics.
Educational Disclaimer
This content is educational and informational only. It does not constitute financial, investment, trading, tax, or professional advice. Cryptocurrency markets are highly volatile and risky, and you should conduct your own research and consult qualified professionals before making financial decisions.
Follow & Sub To One Web One Hub — Your Crypto Probability Analysis Hub
2026 Jan 25 FARTCOINUSDT FI
At One Web One Hub, we publish daily live probability-based market analyses that blend real price data, multi-timeframe structure, VWAP bias approximation, Renko trend interpretation, sentiment context, and key technical zone mapping to help you navigate volatile meme coin markets with clarity.
Bookmark our blog, share with your community, and return daily for fresh analytical insights designed to help you think smarter, not just react faster.
One Web One Hub — your hub for crypto clarity in chaotic markets.
Previous Post FARTCOINUSDT – Probability Analysis for January 23, 2026
Next Post FARTCOINUSDT – Probability Analysis for January 26, 2026


