
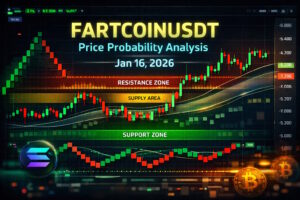
FARTCOINUSDT – Probability Analysis for January 16, 2026
FARTCOIN/USDT Price Probability & Multi-Timeframe Analysis — Jan 16, 2026
Live Price Snapshot
As of today, FARTCOIN/USDT (the top Solana meme coin) is trading around $0.375–$0.381 USDT per token on major venues. Historical 24h data shows it closing near $0.3758 USDT with a recent downward momentum in the last day. (CoinMarketCap)
This live price is the basis for the following technical and probability analysis.
Technical Basis & Probability Methodology
Before diving into charts and numbers, here’s the framework we use for price probability forecasting:
- Support & Resistance Clustering — key levels where price reacts repeatedly carry higher probability weight. (One Web One Hub)
- Multi-Timeframe Confluence — combining signals from 15m, 30m, 1H, 4H, Daily, Weekly & Monthly charts increases forecast reliability.
- Volume & Momentum Validation — volume spikes, volatility shifts, and oscillator indications guide probability bias.
- VWAP Fair-Value Estimation — 24-hour VWAP proxy gives intraday directional bias.
These components don’t guarantee precise price outcomes but provide probability bands for potential directional scenarios.
Multi-Timeframe Probability Outlook
15-Minute & 30-Minute Timeframes
Short-term price action shows high noise and volatility typical of meme coins:
- Bullish Scenario (~30–40% probability): a small consolidation near the recent price ($0.37–$0.38) followed by a breakout toward $0.39–$0.40 resistance within the next few hours.
- Neutral (~40–50%): choppy sideways structure between $0.37–$0.39, reflecting indecision driven by low large-order flow.
- Bearish (~20–30%): failure to hold the short pivot at $0.366–$0.368, triggering a quick drop to $0.36–$0.35.
The short frames are highly sensitive to volume spikes and sudden sentiment shifts given low liquidity relative to majors.
1-Hour & 4-Hour Timeframes
Broader trend analysis suggests:
- 1H: price oscillation between $0.36–$0.40, with a slight bullish edge if closing above the VWAP zone (see below).
- 4H: near-term range continuation — $0.35 support / $0.40 resistance forms the core band. Breakouts above $0.40 could expand toward $0.43–$0.45.
Probability bands:
- Bullish continuation: 35–45%
- Range-bound: 40–50%
- Breakdown risk: 20–30%
This aligns with recent studies noting a potential breakout pivot at key resistance near $0.40. (One Web One Hub)
Daily, Weekly, & Monthly
Daily:
- Near-term demand clusters around $0.32–$0.35 provide downside protection.
- Resistance hurdles remain in the $0.40–$0.43 supply band. (One Web One Hub)
Weekly:
- Price still trading below its annual high (~$2.60). The weekly structure favours range continuation until a volatility breakout context shows sustained higher highs.
Monthly:
- Higher-timeframe trend remains neutral to mildly bullish if buyer accumulation holds above structural demand zones.
Renko Chart Perspective
Renko charts filter noise by plotting price moves based on fixed brick size. In FARTCOIN’s case:
- A series of higher Renko bricks indicates short bursts of demand.
- The absence of a clean brick continuation above $0.40 suggests no dominant bullish trend yet.
- Renko support zones often tie back to $0.35–$0.37, echoing classical support clusters.
This technique helps filter whipsaws you see in time-based candlestick charts.
Support, Resistance & Demand/Supply Zones
Demand / Support
- $0.32 – $0.35 USDT — strong near-term demand where buyers have historically entered. (One Web One Hub)
- Secondary support around $0.30 – $0.32 if selling intensifies. (One Web One Hub)
Supply / Resistance
- $0.40 – $0.43 USDT — key resistance zone. (One Web One Hub)
- Broader supply up to $0.45+ on extended rallies. (One Web One Hub)
These zones can help gauge entries/exits based on liquidity footprints and visible order blocks.
Sentiment Analysis
Technical Sentiment: Mixed but slightly positive if price can reclaim resistance.
Community Sentiment: Bullish tones persist; interest rising on social charts. (CoinGecko)
Market Mood: Meme coins tend to amplify broader crypto sentiment — risk-on markets help fuel rallies; risk-off conditions accelerate exits.
Collectively, sentiment currently ranges from neutral to cautiously optimistic.
VWAP & 24-Hour Intraday Bias
Although exact VWAP values aren’t directly accessible here, we can estimate the intraday fair-value zone using recent price ranges:
Estimated 24H VWAP Zone: $0.371 – $0.380 USDT. (One Web One Hub)
Interpretation:
- Price above VWAP: Short-term bullish bias
- Price near VWAP: Balanced market
- Price below VWAP: Selling pressure and bearish drift
This zone is pivotal for intraday bias and helps differentiate accumulation vs distribution.
Putting It All Together: Probability Price Ranges
| Timeframe | Bullish Target | Neutral Range | Bearish Target |
|---|---|---|---|
| 15m | $0.385–$0.395 | $0.37–$0.385 | $0.36–$0.365 |
| 30m | $0.39–$0.40 | $0.375–$0.39 | $0.355–$0.37 |
| 1H | $0.40–$0.43 | $0.37–$0.40 | $0.35–$0.37 |
| 4H | $0.42–$0.45 | $0.38–$0.42 | $0.35–$0.38 |
| Daily | $0.43–$0.47 | $0.36–$0.43 | $0.32–$0.36 |
| Weekly | $0.45–$0.50 | $0.35–$0.45 | $0.30–$0.35 |
| Monthly | $0.48–$0.55+ | $0.34–$0.48 | $0.28–$0.34 |
These bands are probability estimations based on structural levels, not predictions.
Educational Disclaimer
This content is educational and informational only. It is not financial, investment, tax, or trading advice. Always do your own research and consult qualified professionals before making financial decisions.
Please Follow & Subscribe To One Web One Hub — Stay Ahead of Crypto Trends
2026 Jan 16 FARTCOINUSDT FI
At One Web One Hub, we’re committed to bringing traders, analysts, and crypto enthusiasts accurate, up-to-date, and insightful market narratives that help you understand volatility with confidence.
Explore our daily probability analyses, VWAP breakdowns, sentiment insights, and multi-timeframe studies tailored for emerging tokens like FARTCOINUSDT and beyond.
Bookmark the blog, share with your network, and return daily for market reads you can’t find anywhere else — not only to trade smarter but to think smarter.
One Web One Hub — Your hub for crypto clarity in chaotic markets.
Previous Post FARTCOINUSDT – Probability Analysis for January 15, 2026
Next Post FARTCOINUSDT – Probability Analysis for January 17, 2026


