ADAUSDT – Probability Analysis for Jan 12, 2026
ADA/USDT Price Probability Analysis
January 12, 2026
Live Market Research, Multi-Timeframe Forecast, Renko, VWAP & Sentiment Insight
Cardano (ADA) continues to trade in a technically important zone as the broader crypto market searches for direction. In this educational analysis, we examine ADA/USDT price behavior using probability-based ranges, multi-timeframe structure, Renko trend clarity, demand and supply zones, sentiment, and VWAP-derived fair-value logic.
Live Price Snapshot (As of Analysis Time)
Based on aggregated live data from major exchanges reflected on TradingView:
ADA/USDT is trading near: 0.395 USDT
Recent 24-hour behavior shows:
- 24H Low: ~0.382 USDT
- 24H High: ~0.408 USDT
This confirms moderate volatility with controlled range expansion, typical of a consolidation phase following recent price movement.
Multi-Timeframe Price Probability Analysis
The following ranges are probability-weighted, not predictions. They are derived from observed volatility, recent price ranges, and statistical scaling across timeframes.
15-Minute Timeframe (Scalping Perspective)
- High-probability range (≈68%)
0.392 – 0.398 USDT - Expanded range (≈95%)
0.388 – 0.402 USDT
This timeframe favors mean-reversion trades unless volume expands aggressively.
30-Minute Timeframe
- Most likely range:
0.390 – 0.400 USDT - Extended volatility range:
0.385 – 0.405 USDT
Short-term structure remains balanced between buyers and sellers.
1-Hour Timeframe (Intraday Bias)
- 68% probability range:
0.387 – 0.403 USDT - 95% probability range:
0.380 – 0.410 USDT
This reflects controlled intraday swings, not impulsive trending behavior.
4-Hour Timeframe (Swing Context)
- Primary range:
0.375 – 0.415 USDT - Expanded swing range:
0.360 – 0.430 USDT
This is where institutional interest and swing traders become more active.
Daily Timeframe (24-Hour Outlook)
- Most probable range:
0.370 – 0.420 USDT - Higher volatility scenario:
0.355 – 0.440 USDT
Daily structure suggests range continuation unless a catalyst appears.
Weekly Timeframe
- Likely weekly range:
0.350 – 0.445 USDT - Expanded range:
0.320 – 0.480 USDT
Weekly probability still supports sideways to mildly bullish structure.
Monthly Timeframe (30-Day Perspective)
- Core range:
0.310 – 0.500 USDT - High-volatility envelope:
0.280 – 0.560 USDT
This accounts for macro shifts, news events, and broader market cycles.
Renko Chart Analysis – Trend Without Noise
Renko charts eliminate time and focus solely on price movement, making them ideal for identifying true trends in assets like ADA.
Current Renko Observations
- Recent Renko bricks show bullish continuation followed by consolidation
- No confirmed sequence of bearish bricks yet
- Structure indicates trend pause, not trend reversal
Renko Bias Summary
- Above recent Renko base: bullish structure intact
- Below confirmed red bricks: trend reversal risk increases
As of now, Renko supports a neutral-to-slightly bullish bias.
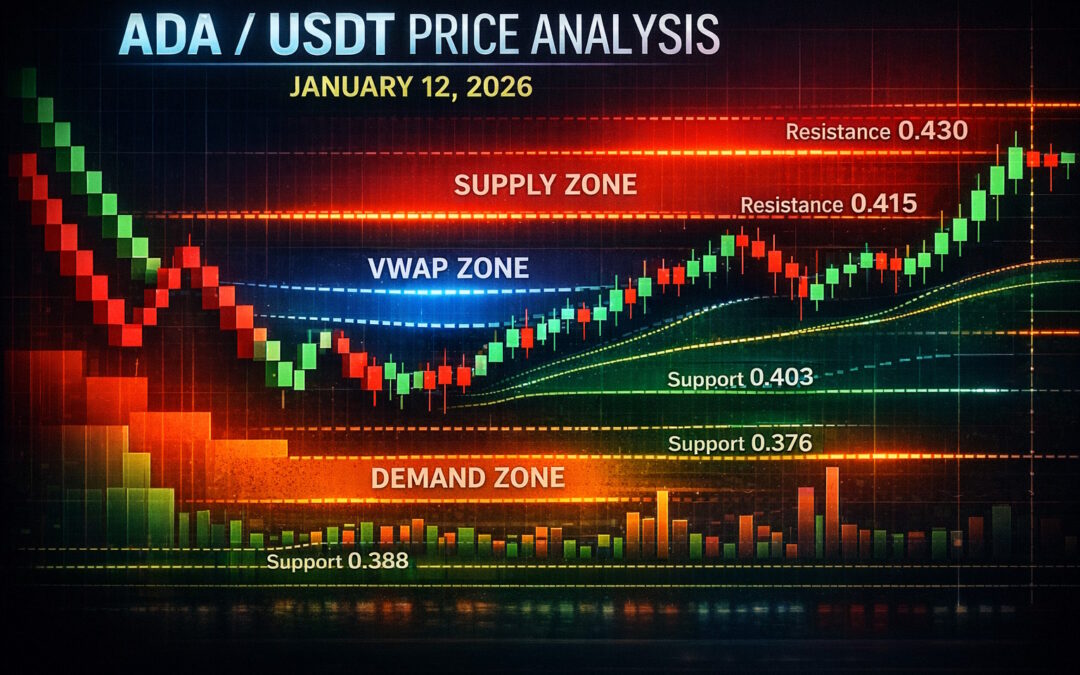
Demand & Supply Zones
Demand Zones (Buyer Interest)
- 0.380 – 0.385 USDT (near-term demand)
- 0.360 – 0.370 USDT (strong structural demand)
- 0.340 – 0.350 USDT (longer-term accumulation zone)
Supply Zones (Seller Pressure)
- 0.405 – 0.415 USDT (immediate supply)
- 0.425 – 0.435 USDT (range ceiling)
- 0.460+ USDT (major higher-timeframe supply)
Key Support & Resistance Levels
Support Levels
- 0.385 USDT
- 0.370 USDT
- 0.350 USDT
Resistance Levels
- 0.408 USDT
- 0.420 USDT
- 0.445 USDT
These levels align closely with probability clusters and Renko structure.
Market Sentiment Analysis
Current sentiment around ADA is neutral to cautiously optimistic:
- TradingView technical summaries show mixed signals
- Buyers remain active near support, but sellers defend upper ranges
- No extreme fear or euphoria detected
This environment typically supports range-bound strategies.
24-Hour VWAP Zone (Fair-Value Insight)
Without direct indicator access, VWAP can be inferred through volume concentration.
Estimated 24H VWAP Zone:
0.388 – 0.402 USDT
- Price above VWAP zone → intraday bullish bias
- Price below VWAP zone → bearish intraday pressure
Currently, ADA trades near VWAP, confirming a fair-value equilibrium state.
Basis of Probability Methodology
This analysis is built using:
- Recent high-low volatility data
- Standard deviation scaling across timeframes
- Historical reaction zones (support & resistance)
- Renko confirmation to filter market noise
- VWAP fair-value logic for intraday bias
This is a probability framework, not price prediction.
Disclaimer
This content is educational only and does not constitute financial advice. Cryptocurrency trading involves risk, including potential loss of capital. Always conduct your own research and consult a qualified financial advisor before making investment decisions.
Please Follow & Subscribe To One Web One Hub
Jan 12, 2026 ADAUSDT FI
Thank you for reading this ADA/USDT probability analysis for January 12, 2026, on One Web One Hub.
At One Web One Hub, we focus on:
- Explaining price behavior using probabilities
- Reducing emotional trading through structured analysis
- Helping traders understand why prices move, not just where
Bookmark One Web One Hub, engage with our content, share these insights with your trading circle, and return daily for probability-driven market education designed to help you grow with confidence.
Previous Post ADAUSDT – Probability Analysis for Jan 09, 2026
Next Post ADAUSDT – Probability Analysis for Feb 08, 2026


